10 - Georg Umgiesser, "The impact of operating the mobile barriers in Venice (MOSE) under climate change" (2020)
| Site: | Bryn Mawr Moodle |
| Course: | ESEM007 - Wonders of Italy |
| Book: | 10 - Georg Umgiesser, "The impact of operating the mobile barriers in Venice (MOSE) under climate change" (2020) |
| Printed by: | Guest user |
| Date: | Sunday, September 13, 2026, 1:08 PM |
1. Introduction
The city of Venice is situated inside the Venice lagoon at the northwestern end of the Adriatic Sea, a marginal sea in the Mediterranean. Here some of the highest tides in the Mediterranean help in flushing out brackish waters and replacing it with marine waters from the coastal shelf in front of the lagoon. The city has been nomi-nated a UNESCO world heritage site due to the beauty of its buildings and churches and its unique setting with its canals and its gondolas.
However, climate change is threatening this delicate system. If IPCC projections are right we could have a sea level rise between 30 cm and 1 m, depending on the RCP scenarios considered (IPCC, 2001, 2007, 2014). Other semi-empirical models predict up to 175 cm of sea level rise (Vermeer & Rahmstorf, 2009). It is clear that for a city that is on average situated only 80 cm above mean sea level, such an increase in water level would be lethal. It is therefore of utmost importance to see how the city can be safeguarded against this global threat.
In the past Venice was subjected to high water events intermittently. The highest event has happened in 1966 with a water level of 194 cm (Trincardi et al., 2016). Recently, on 12th of November 2019, the second highest high water has struck Venice with a water level of 187 cm. What was important in this event was the fact that for one week, water levels were very high and on 4 days they exceeded 140 cm,
a water level that classifies the high water events as exceptional. In the last 150 years there were only 23 of these exceptional events, 9 before year 2000, 14 in this millennium, and 5 in the last 2 years (Cavaleri et al., 2019). A clear sign that Venice will have to prepare for these high water events.
In the last years, construction of the mobile barriers (MOSE) has started in order to be able to defend the city of Venice against high tides and storm surges (Magistrato Alle Acque, 1997). Other (alternative and soft) solutions (Comune di Venezia, 2005) have been proposed that would either decrease the section of the inlets to make it more difficult for the water to enter the lagoon or open the fishing valleys inside the lagoon to create a larger basin for the tide to expand. However, it seems that with a sea level rise above a certain level the only viable way of defending the city against high tides is blocking the water fluxes at the inlets of the lagoon. One of the possible ways to do so is the MOSE project. The starting date of these works was 2003, however, even if now over 90 % of the works have been completed, it is still not yet clear when the whole works will be finished and operational. A possible date of completion is now (at the end of 2019) the year 2021. However, 10 years ago the completion date was 2014 (Water Technology, 2019), so nothing sure can be said about when the MOSE will be finally finished.
In any case, it would be interesting to see how the MOSE will be able to defend the city against high water taking into account sea level rise
⁎ Corresponding author at: CNR – National Research Council of Italy, ISMAR – Institute of Marine Sciences, Castello 2737/f, 30122, Venice, Italy.
E-mail address: georg.umgiesser@ismar.cnr.it.
https://doi.org/10.1016/j.jnc.2019.125783
Received 7 June 2019; Received in revised form 19 November 2019; Accepted 18 December 2019
1617-1381/©2019PublishedbyElsevierGmbH.
due to climate change. Other studies have looked into the climate change impact on the city. A study (Umgiesser & Matticchio, 2006) has explored two possible values of sea level (30 and 50 cm) to see how often the barriers had to be closed and its implication on ship traffic. Based on a static analysis of the tides, another study (Carbognin, Teatini, Tomasin, & Tosi, 2010) estimates the number of closures with a SLR of 50 cm to be around 250. Other studies looked at the economic implications of the closures (Vergano, Umgiesser, & Nunes, 2010).
Here we present a study where we systematically look at a range of sea level rises (from 0 to 200 cm) in order to cover the complete range between best and worst case scenarios. We do on purpose not indicate in what year these scenarios will be reached. This approach makes our study independent from the climate scenarios chosen and therefore more general. This study is also based on simulating the storm surge and the barrier closures with a hydrodynamic model, and not on a static analysis of the tidal peaks.
In the following, we present in Section 2 the study site, the nu-merical model, the closing mechanism and describe the simulations that have been carried out. In Section 3 the results are presented and in Section 4 they are discussed. Finally, conclusions are drawn in Section 5.
2. Materials and methods
The study site
The lagoon of Venice is situated in the northern part of the Adriatic Sea, a part of the Mediterranean Sea. It is about 50 km long and be-tween 10 and 15 km wide. It is connected with the Adriatic Sea by 3 inlets that have depth values ranging between 7 and 14 m (see Fig. 1). The lagoon itself has an average depth of about 1.5 m, with shallow flats at a depth of around 80 cm, salt marshes that are above sea level, but also with narrow tidal channels that may reach up to 12 m and that cut through the shallow areas.
The semi-diurnal tides create strong fluxes through the inlets that may reach during spring tides 20,000 m3/s at peak flow through all inlets. Compared to the average flow of the Po River of 1,500 m3/s this is quite an impressive value.
The pavement level of Venice is on average only about 80 cm above mean sea level. Some of its most prominent parts (Rialto, St. Mark’s square) are even lower, around 55 cm above mean sea level. Since the spring tide amplitude is 50 cm, just a small meteorological contribution will be able to flood St. Mark’s square. The local datum, which has been established in 1872, is not corresponding anymore to the mean sea level but is 30 cm lower (Comune di Venezia, 2018) due to subsidence and sea level rise in the 20th century. In this work all water levels are re-ferred to this local datum. Therefore, the actual mean sea level is at 30 cm above datum and a closing level of 110 cm (above datum) as described below is at a level of 80 cm above mean sea level. In order to better explain this situation Fig. 2 can be consulted where possible le-vels of sea level rise and the flooding of the city due to the astronomical tide are shown.
The numerical model description
A framework of numerical models (SHYFEM, http://www.ismar. cnr.it/shyfem) was applied to the domain that represents the Venice lagoon (Fig. 1). These models consist of a finite element 3-D hydro-dynamic model, a transport and diffusion model and a radiation transfer model of heat at the water surface. SHYFEM was previously successfully applied to many coastal environments (Bellafiore et al., 2011; De Pascalis, Pérez-Ruzafa, Gilabert, Marcos, & Umgiesser, 2012; Ferrarin & Umgiesser, 2005; Ferrarin et al., 2010; Ferrarin et al., 2013; Umgiesser et al., 2014).
The model resolves the 3-D primitive equations, vertically in-tegrated over each layer, in their formulations with water levels and
transports. The horizontal spatial discretization of the unknowns is carried out with the finite element method, which is especially well suited to describe the complex morphology of the investigated coastal system. In this application, the model is applied in its 2D version, which perfectly adequate due to the shallow nature of the lagoon and the scope of this study which is tidal propagation inside the lagoon. The SHYFEM model has been validated in previous works reproducing water level and current velocities in the Venice lagoon. For more details of the model equations and their solution please see Umgiesser, Melaku Canu, Cucco, and Solidoro (2004).
In order to simulate the closing of the inlets a special module has been implemented that allows the fluxes at the inlets to be reduced and to simulate the closing of the mobile gates. The exact closing protocol is described in the next section.
The closing procedure
The closing procedure is described in some internal reposts of the Consorzio Venezia Nuova, the engineering company that oversees and coordinates the building of the MOSE. A detailed description can be found in another article (Umgiesser & Matticchio, 2006). However, here we present the most important parts of this procedure.
The closing procedure is based on two water level values, one predicted and one measured at Punta Salute, the historical tide gauge that is in place now for more than 150 years. The decision to close the barriers is based on the forecasted water level at Punta Salute. If 4 h before the peak level this maximum value is higher than the safe-guarding value, then the decision to close the lagoon is taken. The safeguarding value is normally set at a value of 110 cm, because this is the topographic level to which most of the pavements of the historic city have been raised. Please note that this safeguarding level will avoid the flooding of a large parts of Venice, but it will not avoid the flooding of St. Mark’s square.
Once the decision has been taken to close the lagoon, a threshold value is established that will be used to decide when the barriers are closed. Depending on the meteorological situation (wind speed, rain) this threshold value is between 55 cm (extreme events) and 90 cm (normal storm surge). When the measured water level at Punta Salute has reached this threshold value, the barriers start to close. The closing of the barriers will take 30 min, and in all three inlets the barriers will be closed at the same moment.
The opening procedure is not described in the report mentioned; therefore, we have applied an empiric modus operandi. When the water level is falling outside in the Adriatic Sea and its value is lower than inside the inlet, the inlet is again opened. In addition, the opening procedure is estimated to take 30 min. In this case, however, it is clear that depending on the water level close to the barriers, the three inlets may be opened at different times. Inlets that experience a set up inside the lagoon will open earlier than inlets where the water level is lower. Summarizing, the predicted water level at Punta Salute is used for the decision, if the gates have to be closed, but the observations at Punta Salute are used to decide, when to close. Finally, the local water level difference between inside and outside the lagoon will be used for
the decision when to re-open the lagoon.
Water level variation in the closed lagoon
When the lagoon is closed, the water level might still change. This is true because of rainfall, river discharge and leakage through the barrier elements. While the first two points are easily integrated into the si-mulations by adding the rain as a distributed source and the rivers as point sources, the third point needs some explication. Every inlet con-tains a certain number of single barrier elements, the Lido (northern-most) has two barriers with 21 and 20 elements, Malamocco (central) has 19 and Chioggia (southern) 18. The elements are 20 m wide and are not connected between each other. This means that there is some gap
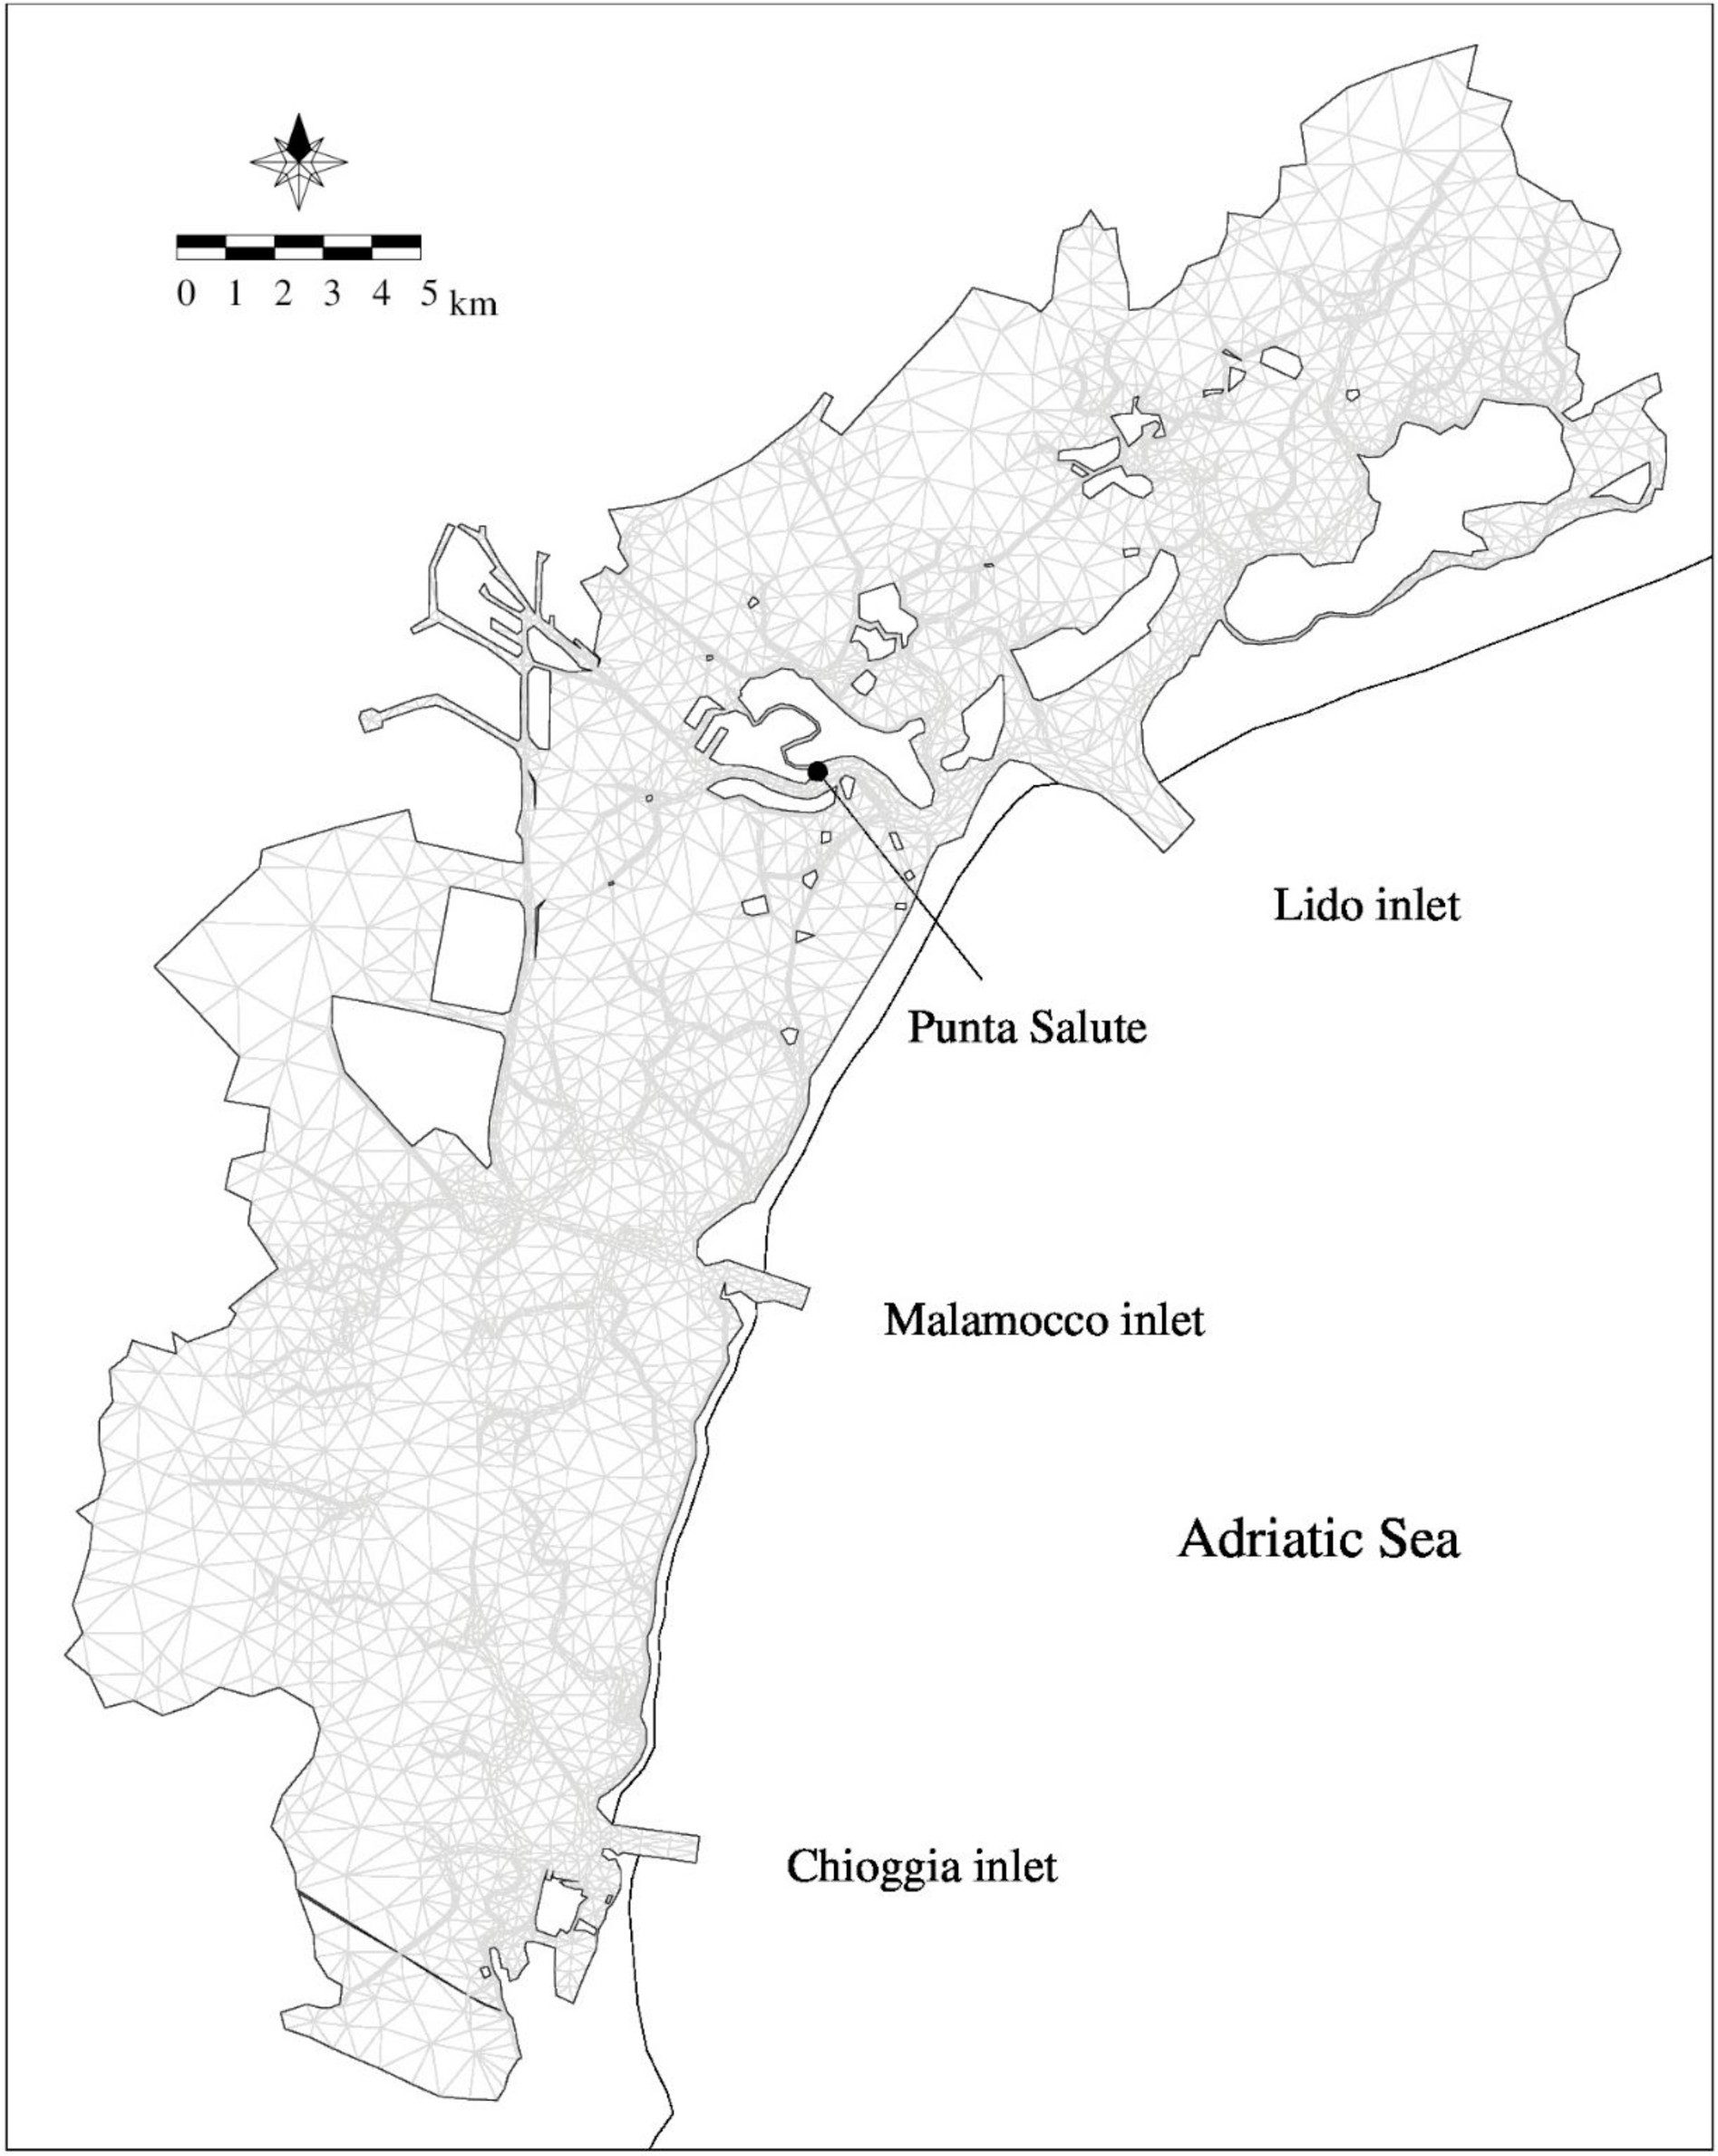
Fig. 1. Overview map of the Venice Lagoon. Indicated are the three inlets and the tide gauge Punta Salute in the city center. Superimposed is the finite element grid used for the simulations.
(about 5−10 cm) between the elements and that the elements can also oscillate. The stronger the waves (and the wind), the more the elements start to oscillate, with the effect that more water can enter between the elements.
A study (Collegio Di Esperti Di Livello Internazionale, 1998) has estimated the water level rise inside the lagoon due to the water leakage between the barrier elements, and values range from 2.7 mm/h for calm
conditions to 21 mm/h for high waves under stormy weather. A non-linear correlation between wind speed and water level rise has been derived (which can be found in Umgiesser & Matticchio, 2006) and implemented in the model code. The highest water level rise of 21 mm/ h is assumed for wind speeds of over 25 m/s.
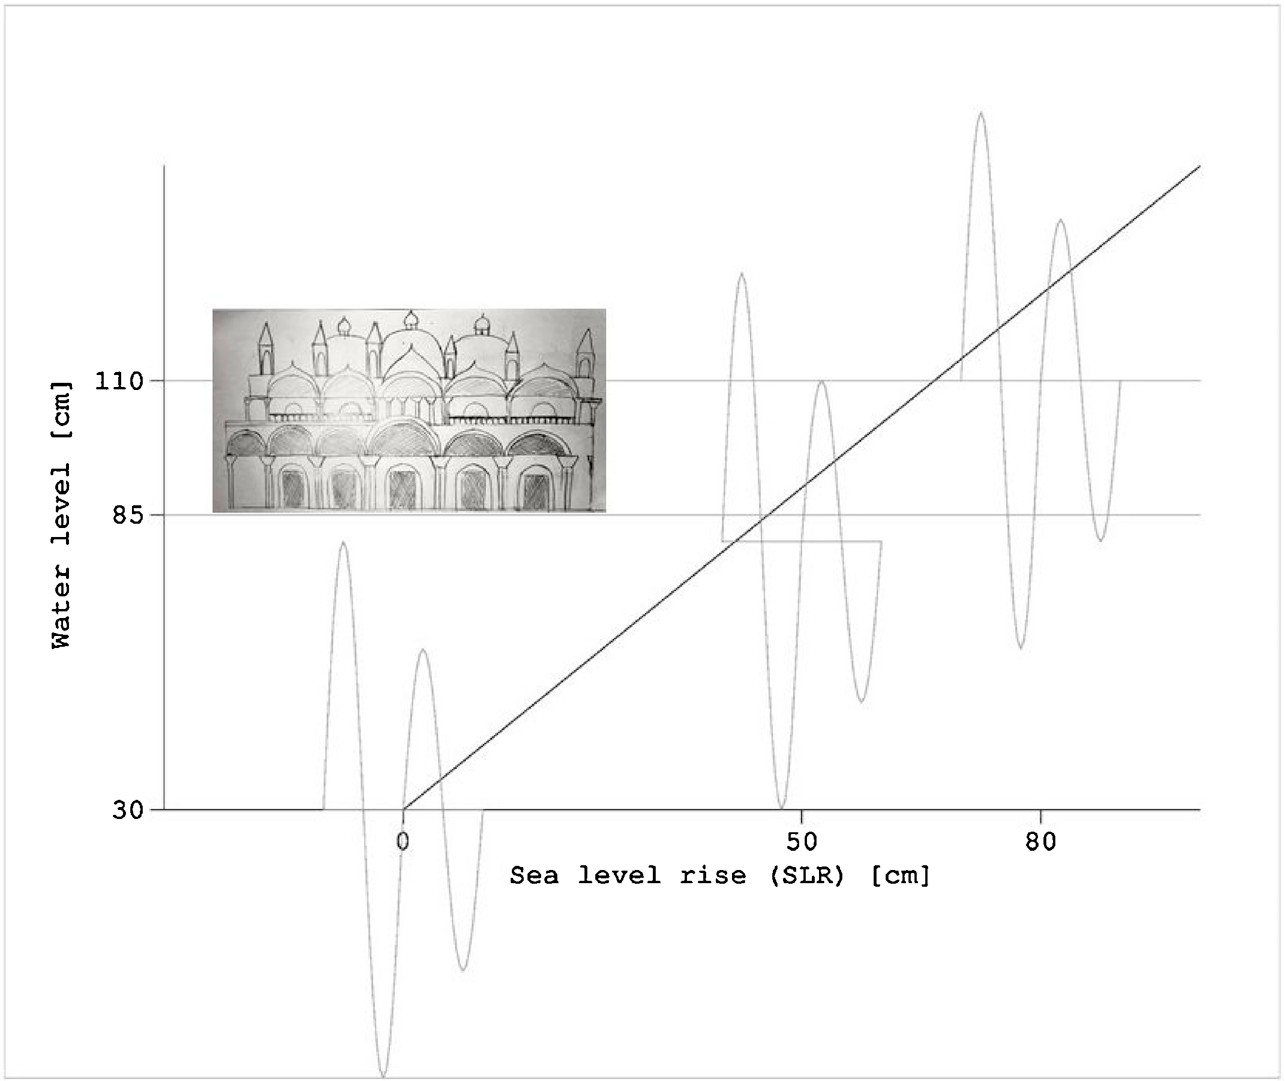 Fig. 2. Sea level rise and the associated average water level in Venice. On the x-axis the possible SLR are plotted, and on the y-axis the important topographic levels referred to datum for Venice are indicated. A level of 30 cm above datum correspond to the present average water level, 85 cm to the medium height of St. Mark’s square (indicated by the sketch, the sketch is not to scale), and 110 cm to the safeguarding level, which is also the height to where most of the pavement of the city of Venice has been raised. In the figure also the oscillation of an astro-nomical spring and a neap tide has been inserted. As can be seen, with a SLR of 50 cm St. Mark’s square is flooded nearly half of the time.
Available data
In this study, measured wind and rain data is used for the years 2000–2002. The data is observed at the oceanographic tower of CNR, about 8 nautical miles in front of the Venice Lagoon, in the Adriatic Sea. In operational use, this has to be clearly substituted with data coming from operational forecast models. Using observed data removes the uncertainty connected with the meteorological situation. For the above period real forecast data for water levels (Canestrelli, 1999) has been made available by the Tidal Forecast Center of Venice Municipality (CPSM). This does effectively allow accounting for the uncertainty with water level predictions, which is an important factor in operating the MOSE barriers and may lead to both false alarms, useless closures and missed closures. This will then also influence the statistics of closures of the barriers.
The reason to use the years 2000–2002 is because only for these years water level forecast data coming from the operational model was available. For these years the average number of events above 110 cm is 8 per year, which is in line with the last 20 years, where we have ap-proximately 6 events per year.
Hourly river data was not available, only climatological averages could be retrieved that cannot be used for this study. The matter has been resolved by using the same amount of rain for the rivers. As pointed out by another study (Rinaldo et al., 2008), this eventually overestimates the river input, which would be more diluted in time. However, it is anticipated that the important findings in this study are not depending on this detail, and the statistics provided later in the paper are only marginally impacted by this decision.
The simulations
The model has been run for 3 years (2000–2002) in a variety of configurations. First of all, sea level rise (SLR) has been simulated by increasing the average sea level in 10 cm steps, from the present state (0 cm) up to a catastrophic sea level rise of 200 cm. This is not to imply that such a value for the SLR is probable at the end of this century, but to show the long term effects that the SLR has on the possible closures of the mobile barriers.
A first set of simulations is carried out by simply running the model
for the three years without any mechanism of closing. This is called, for every SLR, the reference simulation (REF). A second set of simulations (FOR) is then run by simulating the mobile barrier operations. Every time the procedure described above, using the water level forecast, makes the decision to close the gates, the lagoon is closed by artificially reducing the discharge through the inlets to zero, effectively detaching the lagoon from the sea. This is done for all three inlets.
In another set of simulations (SEC), and in order to effectively ac-count for the uncertainty of the water level prediction (important for the decision to close the barriers), a so-called security increment has also been introduced. This security increment is added to the water level forecast to make sure that, even in case of an erroneous forecast, the mobile gates would still be closed and Venice would not be subject to flooding. Uncertainty of the forecast in case of stormy conditions is presently in the order of 10 cm (Zampato, Bajo, Canestrelli, & Umgiesser, 2016). Therefore, 10 cm have been used for this security increment.
Another set of simulations is also carried out where the forecast data has been substituted by observed data of the water level (OBS). In this way, the uncertainty of the water level forecast has been completely eliminated. This is certainly the best scenario for what concerns flooding of Venice and the estimated number of closures (no false alarms and no missed closures). All sets of simulations are summarized in Table 1.
All simulations have been carried out accounting for the leakage of water through the barriers as well as river and rain input. As described above, river data has been estimated through rain data. In any case, extra simulations that have been carried out (and are not shown here) indicate that this assumption is not crucial for the results shown later.
3. Results
Statistics of closures
In Fig. 3 the statistics of the total closures per year is shown. It can be seen how (depending on the type of closure, see Table 1) the number of closures rise from the actual situation with no SLR of 5–12 closures to 300–430 closures for a SLR of 50 cm, peaking at around 75 cm (550 closures) and leveling off at SLR higher than 140 cm to a little more
Table 1
Overview of simulations. For all types of simulations, 21 simulations have been carried out simulating a SLR from 0 to 2 m in 10 cm increment.
|
Name |
Acronym |
Water level used for decision of closure |
Closure |
|
Reference |
REF |
n.a. |
No closure |
|
Forecast |
FOR |
Forecasted water levels |
Total closure |
|
Security increment |
SEC |
Forecasted water levels + security increment |
Total closure |
|
Observed |
OBS |
Real observed water levels |
Total closure |
|
No Lido |
NLI |
Real observed water levels |
Partial Closure |
|
Only Lido |
OLI |
Real observed water levels |
Partial Closure |
than 200 closures. The total number of closures using either the forecast or the exact water level (not available in the operational situation) are quite similar, but the number of closures that adds a 10 cm security increment is much higher, at least for smaller SLR. For SLR of more than 100 cm all curves coincide.
Not only the number of closures can be computed, but also the total time the lagoon stays closed during a closure. In normal situations, the closures should last an average of 4 h, but with higher SLR the period of closures become longer. Fig. 4 shows the statistics for the total time of
closure per year. The time of closure passes from the present situation of some hours (22–44) to about 1400−1800 hours with SLR of 50 cm, which is still compatible with the average of 4 h per closure. However, with higher SLR (over 140 cm) it reaches a plateau of about 8200 h. Since the year has 8760 h, the situation in which half of the time the lagoon is closed happens with a SLR between 70 and 80 cm. The periods with scenario FOR and OBS are nearly identical, and SEC is always higher. However, above 80 cm of SLR the curves coincide.
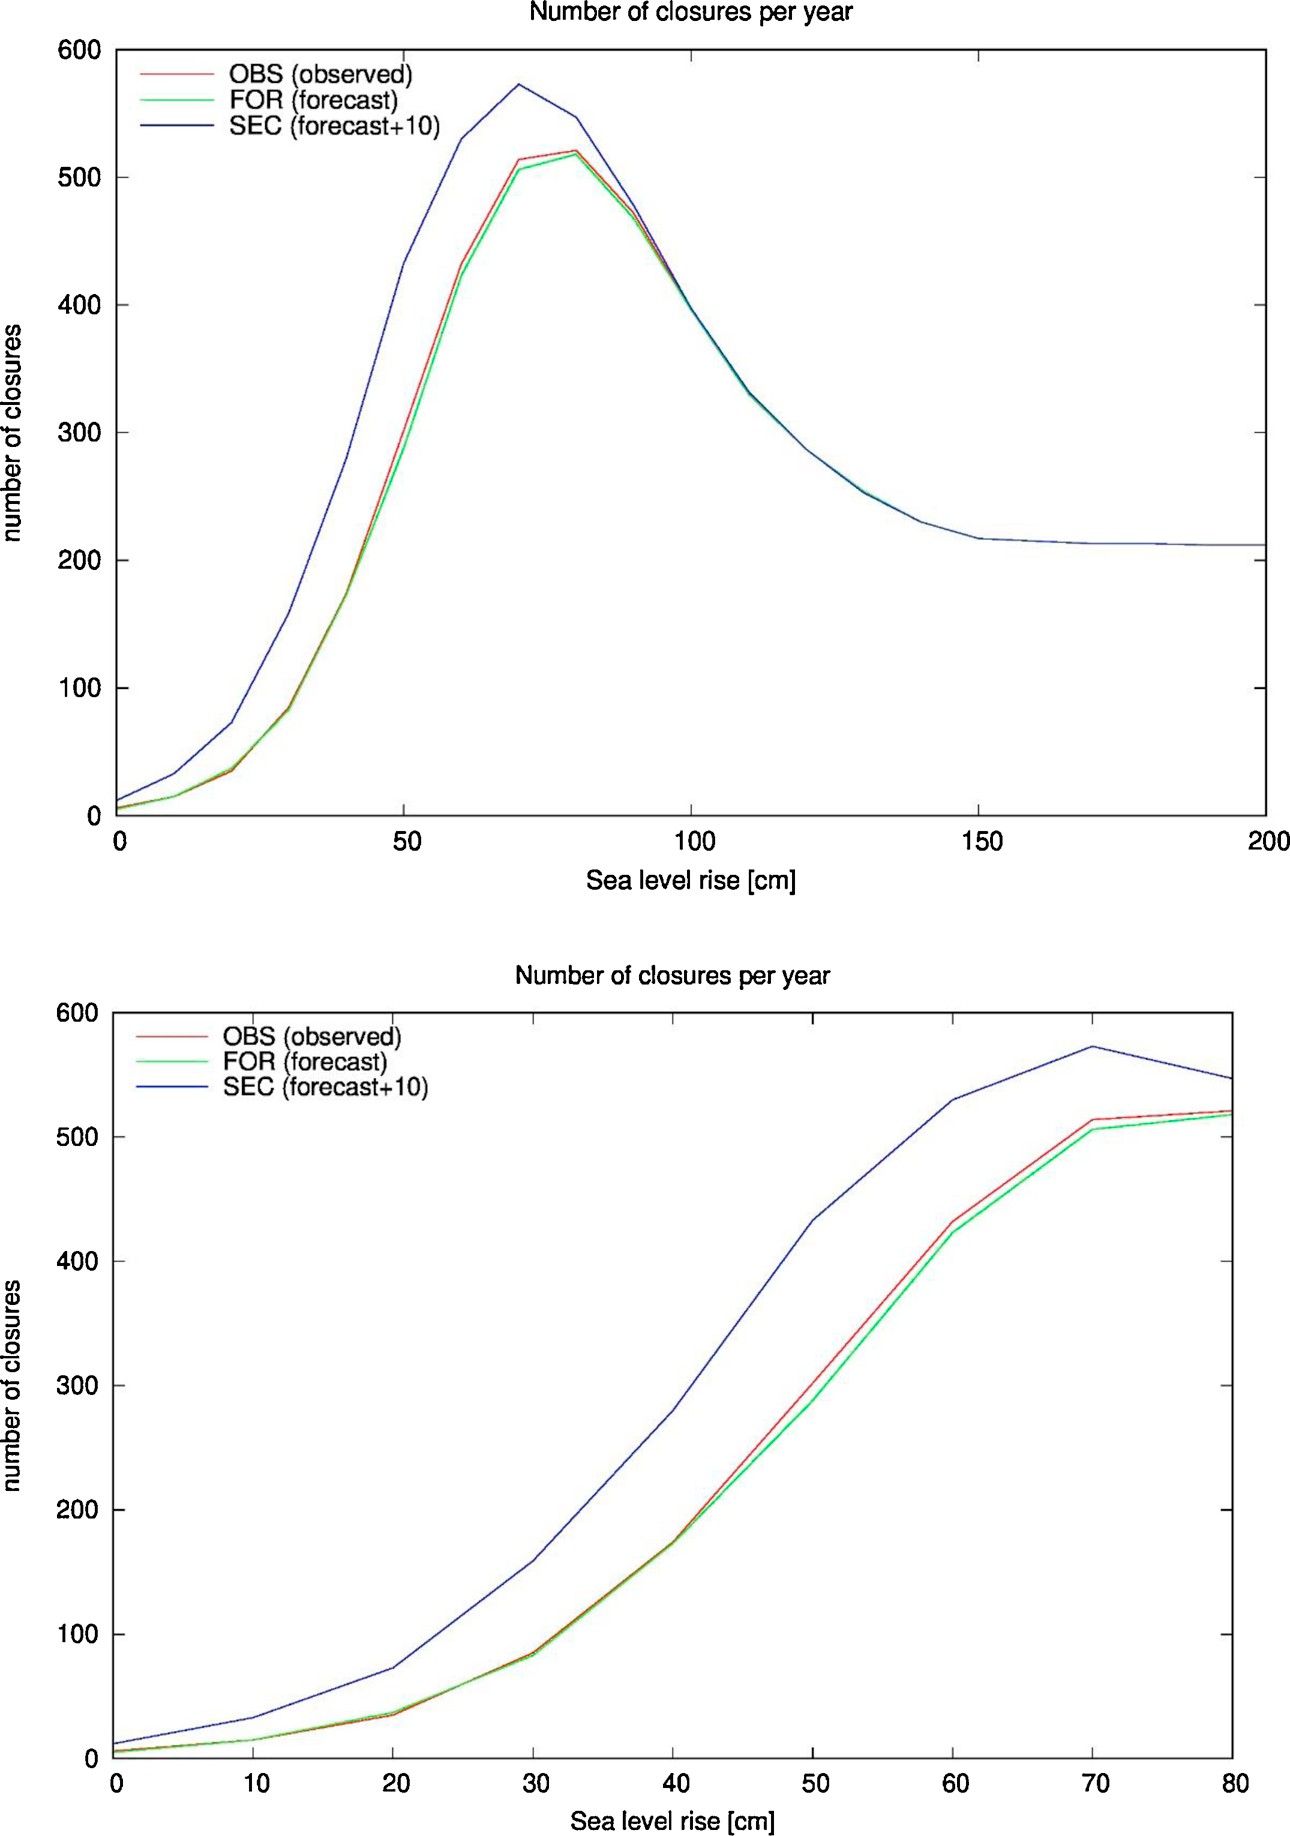
Fig. 3. Number of closures per year with different sea level rise and three different types of closure. Top shows SLR from 0 to 200 cm, bottom only the first 80 cm. The type of closure is described in Table 1.
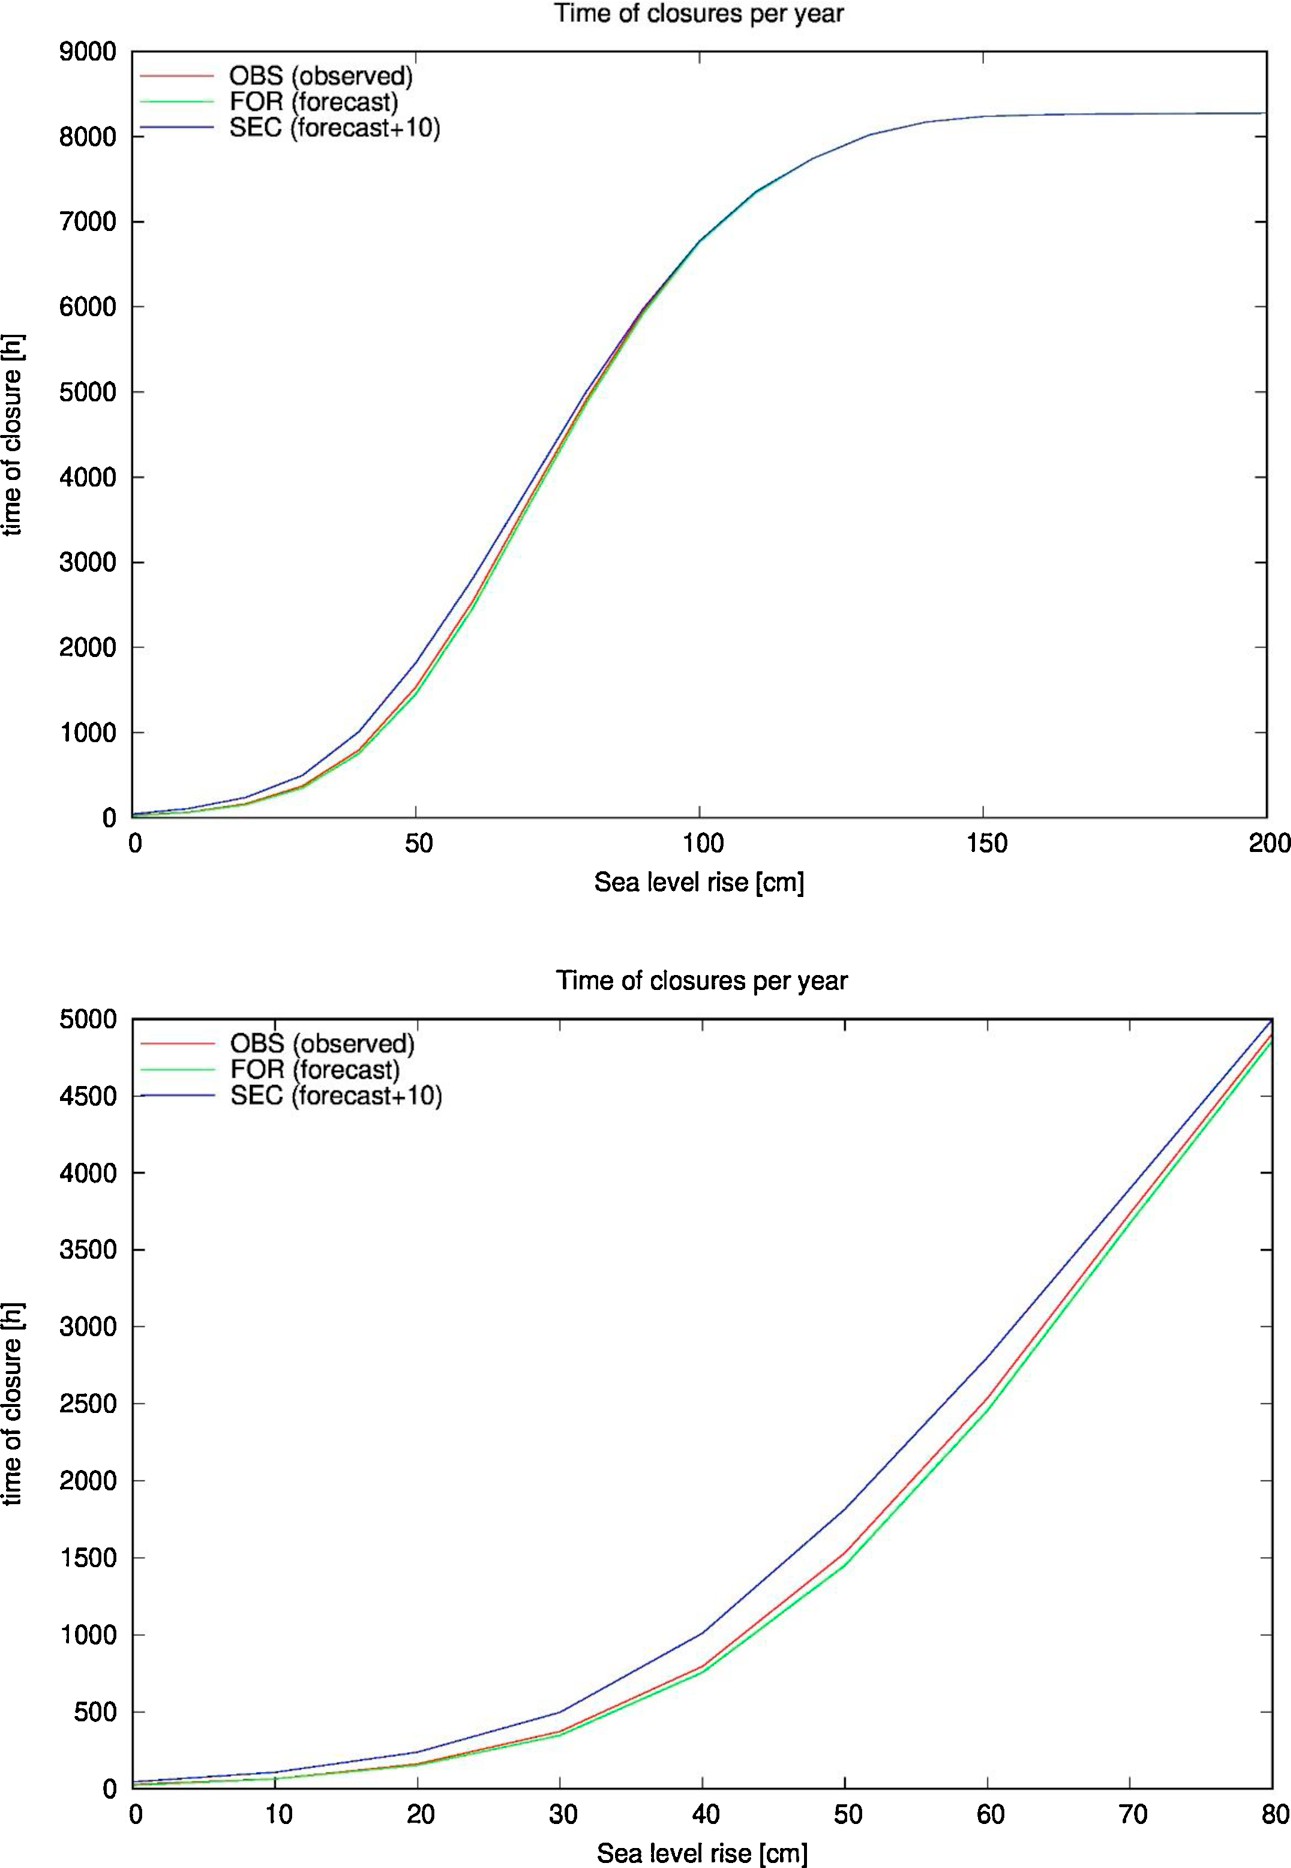
Fig. 4. Total time of closures per year with different sea level rise and three different types of closure. Top shows SLR from 0 to 200 cm, bottom only the first 80 cm. The type of closure is described in Table 1.
Over threshold
It can be also computed how many times and hours the water level in the lagoon rises over the threshold of the safeguarding level of 110 cm. This can happen because with the forecasted water level, errors in the forecast could lead to non-closures. It can also happen because in some cases, even with the lagoon closed, the water level rises due to the discharges of rivers and precipitation, and also due to leakage through the closed gates. Fig. 5 shows the results. In the present case, the mobile barriers can effectively protect the city, and only in a negligible number of hours the water level rises higher than 110 cm (6 h in the worst case). With a SLR of 30 cm these numbers rise to between 5−30 hours, and with 50 cm to 18−100 hours (35 h for the OBS scenario). However, above a certain SLR (here 100 cm) the curve starts to rise strongly and reaches at about 160 cm the value of 8600 h, nearly the whole time of the year. At this level of SLR (100 cm) the average sea level in the sea is 20 cm higher than the safeguarding level at which the MOSE has to be closed. This means that only at low tide the gates can still open, and the lagoon fills up continuously with water coming from the sea.
These numbers should be compared to the time over threshold when the mobile barriers are not active (REF curve in Fig. 5). The number of hours rises steeply already with smaller SLR values. With a SLR of 50 cm Venice would be flooded for more than 1000 h.
Fluxes through the inlets
Closing the mobile barriers certainly also has an effect on the water exchanges through the inlets. The exchange will then depend through the numbers of closures also on the SLR. With the simulations it is possible to compute the average water flux through the inlets. In the present case, and without closures (REF), the discharge is 4654 m3/s (daily average over simulation). When the mobile barriers are active, in the present case without SLR, the discharge reduces a little to between 4622−4637 m3/s, depending on the scenario.
Fig. 6 shows the dependence of the discharge on the SLR. Without any closures the discharge is rising continuously with rising SLR values. However, when considering closures of the mobile gates, with low le-vels of SLR the discharge rises to a level of about 4850 m3/s for about
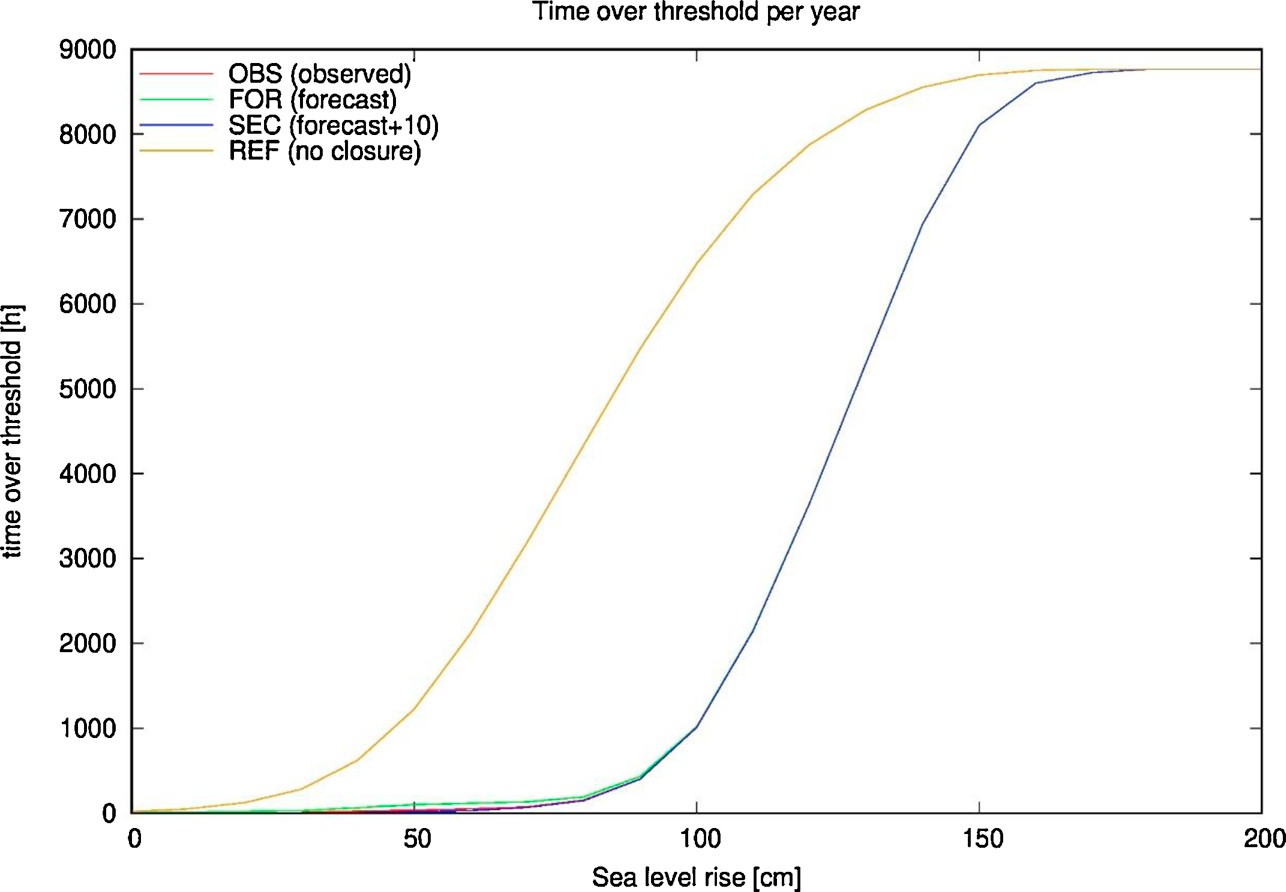
Fig. 5. Total time of flooding over threshold per year with different sea level rise and three different types of closure. The threshold here is 110 cm. The type of closure is described in Table 1.
20−30 cm of SLR, and after this level the discharges start to decrease strongly. At a SLR of over 150 cm the discharges stabilizes at a level of about 160 m3/s.
Partial closures
In the above simulations the mobile barriers have been used in an all or nothing mode: either they are open or they are closed all together. There is however also the possibility of a partial closure, where some inlets are closed and others are kept open. Here two cases have been studied: the case where only the Lido inlet (the northern one) will be closed (OLI) and the case where the other two inlets will be closed and only Lido will be open (NLI). The Lido inlet has been chosen for this experiment, because it is the closest inlet to the historic city, and therefore considered the most important one for high water.
Results can be seen in Fig. 7 as a scatter diagram. Only one situation is shown that will make the point for the other ones. Here a SLR of
50 cm and a security increment of 10 cm have been adopted. The figure shows that, without closures (REF) the water level inside the lagoon is slightly amplified with respect to the levels outside the lagoon. If a total closure is made, the safeguarding level of 110 cm can be defended in almost all instances. Only for an average of 18 h per year the level of 110 cm is exceeded, and only in one instance the water level reaches 120 cm. This is certainly a sign that in almost all events the MOSE is able to defend the city from high water.
If the lagoon is only partially closed (either only Lido or only the other two inlets), a significant reduction of the sea level cannot be achieved. As can be seen in the figure, the values inside the lagoon are more similar to the situation without any closure, and for a storm surge with values higher than 130 cm, basically all the water levels inside the lagoon are higher than the safeguarding level. The water level (average per year) will be higher than 110 cm for around 600 h (Lido only clo-sure) and 900 h (No Lido closure).
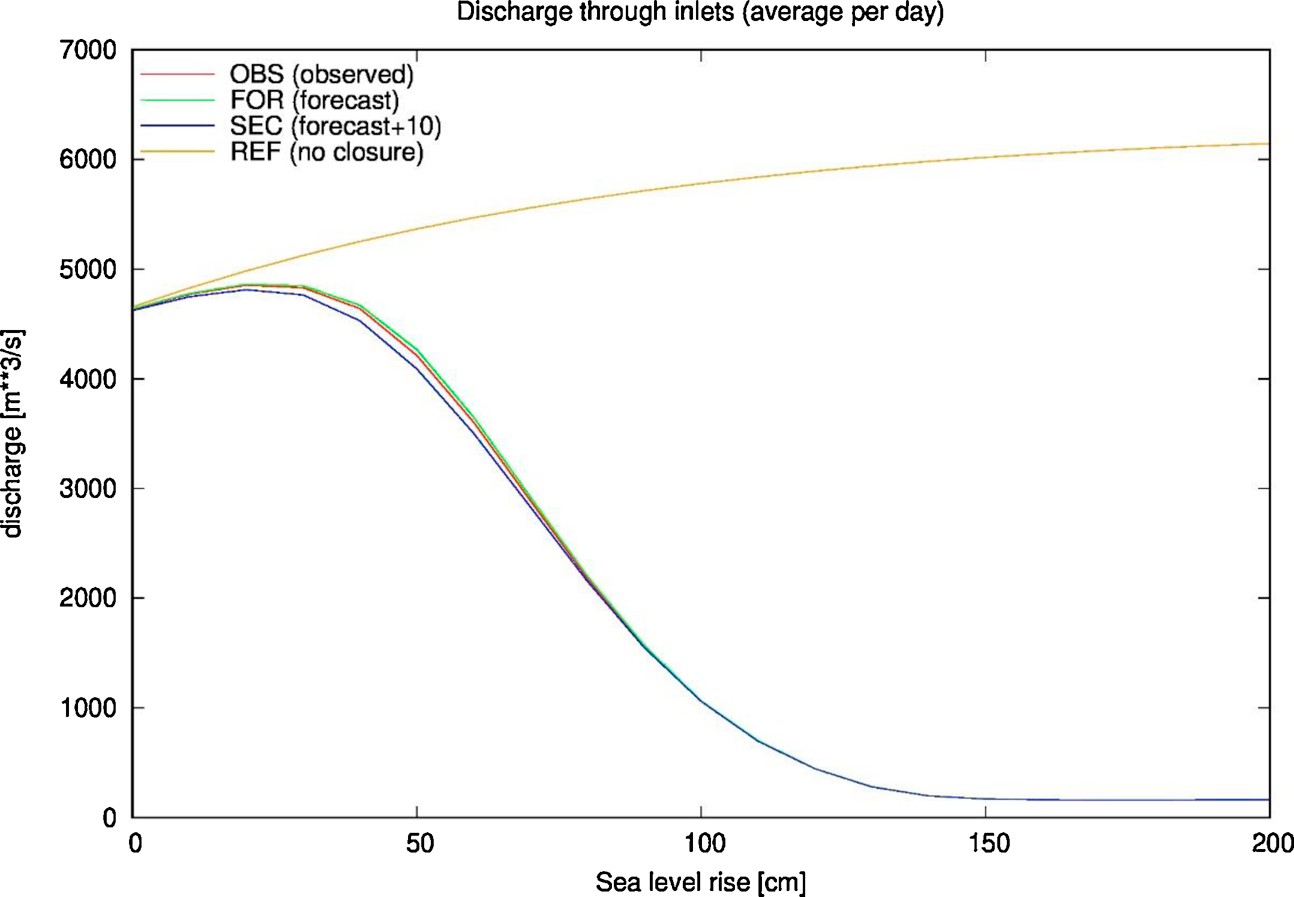
Fig. 6. Total discharge through inlets (daily average over simulation) with different sea level rise and three different types of closure. In addition, the discharge for the reference simulation (no closures) is also shown. The type of closure is described in Table 1.
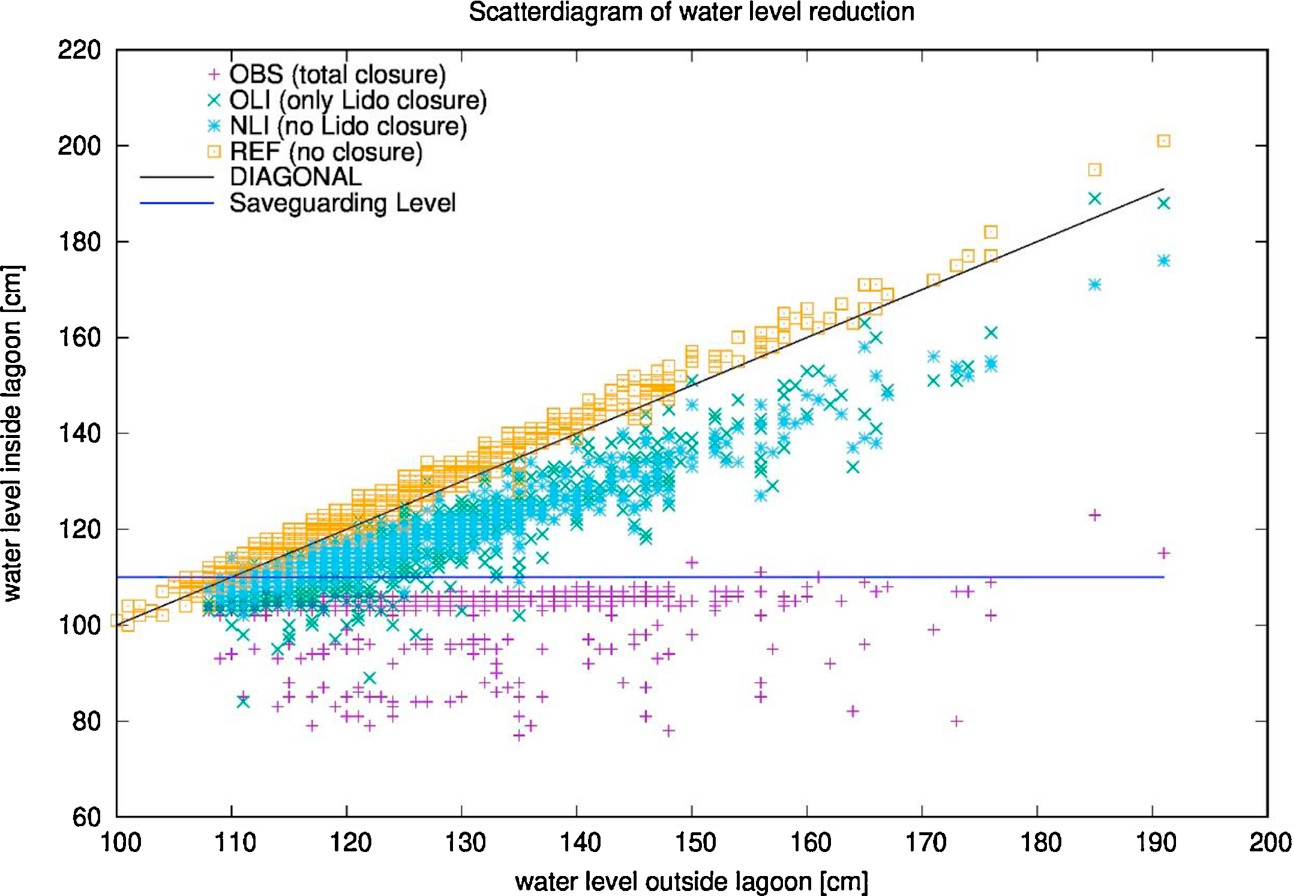
Fig. 7. Peak water levels outside and inside the lagoon for a SLR of 50 cm and different type of closures. The type of closure is described in Table 1. It can be clearly seen that a partial closure of the lagoon is not able to keep the water level below the safeguarding level.
4. Discussion
Without operating the mobile gates Venice will be flooded in the future quite heavily. As can be seen in Fig. 5, with the REF scenario (no closures) the city of Venice will experience flooding for more than 1000 h when the sea level rises for 50 cm.
When taking into account closures at the inlets, the above results show that the mobile barriers in Venice (MOSE) will actually be able to defend the city from high water in the near future. Even with a SLR of 50 cm the time (average per year) the safeguarding level will be ex-ceeded is only 18 h (in case a security increment is used for the forecasts of 10 cm). In the worst case (using the possibly wrong forecast levels without modification), this time rises to 100 h per year. Since forecast models are expected to improve in the future, the time of flooding should be lower than this number.
Clearly, these findings do not apply to a SLR above a certain level. With a SLR of 100 cm the total time of flooding per year is close to 1000 h. In this case the MOSE will certainly not be able to defend the city of Venice from high tides any more.
However, the time of flooding is only one part of the story. If we look at the number of closures the story changes. For a SLR of 50 cm, as shown in the results above, the gates will have to be closed between 300 and 430 times a year, this is one closure per day on average. This is an incredibly high number of closures and the mobile barriers were not planned for this frequency of closures. What concerns the total time the barriers are closed, with 50 cm SLR this time ranges between 1400 and 1800 h. The frequent and long closures will have a negative effect on the shipping that has to go through the inlets to reach the industrial and touristic port. Since Lido has no sluice gates to let the passenger ships pass, all traffic in case of closures has to go through the central Malamocco inlet, which is equipped with a sluice gate. It remains to be seen if only one sluice gate is able to handle the whole ship traffic, both industrial and touristic one.
From Fig. 3 it is interesting to note that the scenarios of using forecasted values (FOR) and using observed values (OBS) are very si-milar in the number of total closures, only scenario SEC (forecast with security increment) shows a higher number of closures. Moreover, for very high values of SLR all three curves give basically the same answer. Therefore, for the sake of statistics it is really not important to distin-guish between the two scenarios FOR and OBS, and observational va-lues can be directly used for this kind of study.
The number of closures decreases from a maximum value of 500 (FOR and OBS) to a nearly constant value of 210 closures per year, equal for all scenarios. This is because the water level outside the la-goon is so high, that it is nearly always above the value of the safe-guarding level. Since the average sea level is presently around 30 cm above datum, a SLR of 80 cm will bring the mean sea level to 110 cm, equal to the safeguarding level. Moreover, because the tidal amplitude during spring tide is 50 cm, a SLR of 130 cm will bring even the low tide above the safeguarding level of 110 cm. In this case, the closing and opening procedure breaks down and cannot be applied anymore. During the short periods where the water in the lagoon is higher than in the sea, the barriers are opened, just to be closed again after a short period.
The same can be seen when looking at the total time of closure. For very high SLR, the lagoon is nearly all the time closed (8200 h of 8760 total hours in a year). Even more interesting, with a value of 75 cm of SLR the lagoon is closed 4400 h (all scenarios have similar values). This means that with a SLR of 75 cm the lagoon starts to be longer closed than open. In this case we must speak about opening the lagoon, and not so much any more about closing the lagoon.
However, the average fluxes through the inlets show another point. With increasing levels of SLR, the fluxes, at first, start to rise. The ex-planation to this surprising tendency is that with higher water levels, the section of the openings is bigger and also friction inside the inlets is lower. Therefore, more water can enter or exit the lagoon more easily than before. This effect can be clearly seen by looking at the REF case (no closures) in Fig. 6. On the other side, when operating the gates, the number of closures is small and does not really influence the water budget of the lagoon. The maximum of fluxes is achieved between 20 and 30 cm SLR (with the closing active). After this point, the discharges start decreasing. This means that higher levels of SLR and smaller va-lues of friction are now offset by the increasing number of closures that have to be carried out. At 40 cm SLR the discharges are back to present values. After this point exchanges are strongly affected by the closure of the inlets, and continue to decrease until about 150 cm SLR, where they stabilize at a rate of 160 m3/s. This is what can be called the metabolic exchange value that is always maintained, determined by the closing procedure used in this article.
It is interesting that for small values of SLR there is a positive effect what concerns the exchange rates and water renewal capacity of the lagoon, even if the lagoon is being closed during high tides. This is
certainly something that could not have been anticipated by just looking at the increasing number of closures. At a SLR of 50 cm the lagoon has to be closed about once a day (350 closures correspond to approximately a 50 fold increase with respect to the present numbers). However, the exchanges through the inlets at these levels of SLR do not yet really feel this number of closures and the reduction through the inlets is only around 10 % compared to the present fluxes.
Finally, the results also show the relative ineffectiveness of partial closures. If it is decided to only close Lido, or leave Lido open, a small reduction of water level can be found inside the lagoon and at the city of Venice. Moreover, as Fig. 7 shows, for storm surges that are higher than 130 cm, nearly always the water levels inside the lagoon exceed the safeguarding level, and flooding of the city will happen. Relying on partial closures is therefore not a viable strategy, and the gates should be operated always together in order to guarantee a water level below 110 cm. There might be situations where using partial closures could be beneficial (e.g., artificially enhancing the circulation), but certainly not for the storm surge protection of the city.
Other studies have been carried out looking at the impact of the MOSE on various aspects. One study (Ghezzo, Guerzoni, Cucco, & Umgiesser, 2010) looked at the influence of the construction works on the internal circulation and the exchange capabilities (water renewal times) of the lagoon. In another article Bellafiore, Ghezzo, Tagliapietra, and Umgiesser (2014) studied the effect of the mobile barrier closures on the salt marshes and their survival. The impact of the closures on the oxygen levels was also studied (Melaku Canu, Umgiesser, & Solidoro, 2001). Other points to be studied are the microbiological pollution in the lagoon and the impact the MOSE has on these parameters. More-over, all these studies only looked at single events and did not explore longer time periods and different levels of SLR.
Recently, two articles (Del Bello, 2018; Reimann, Vafeidis, Brown, Hinkel, & Tol, 2018) also commented on the effects that the closure could have on the ecosystem. Both articles express the opinion that a high frequency of closures could be harmful for the Venice ecosystem. However, these aspects remain to be studied more thoroughly.
One might ask what the options for the city of Venice are. At this point is quite difficult to say. One proposed solution (Gambolati & Teatini, 2013) is to raise the city by pumping water into the under-ground. The study declares the possibility to raise the city of Venice by about 30 cm permanently. Another obvious possibility is to perma-nently separate the lagoon from the sea by building static barriers.
5. Conclusions
It becomes clear from the results above that the mobile barriers will be able to protect the city for moderate rises of the sea level, even with an elevated number of closures. However, it must be stressed that this study only deals with flooding and water levels.
Even if the mobile barriers will be able to protect the city up to a SLR of approx. 50 cm, the price is high when considering on average a frequency of one closure per day of the barriers. Above this value of SLR, it will become inevitable to consider a more radical solution. A possible solution is to raise the city by injecting water in the under-ground, another one is to completely close off the lagoon from the sea. Clearly, here we only consider hydrodynamics and the water level.
Implications on other aspects like temperature and salinity levels, or on the ecosystem will need a different treatment, and the frequent closures may have more profound effects on these topics. These aspects will be studied in subsequent articles.
6. Declaration of Competing Interest
None.
7. Acknowledgements
This study has been carried out under the framework of the RITMARE Flagship Project, funded by MIUR under the NRP 2011–2013. Moreover, this scientific activity was performed with the contribution of the Provveditorato for the Public Works of Veneto, Trentino Alto Adige and Friuli Venezia Giulia, provided through the concessionary of State Consorzio Venezia Nuova and coordinated by CORILA. The author wants to thank the Venice Municipality for the provided forecast data used in this study. Finally I want to thank my daughter Clara to provide me with the drawing of St. Mark’s basilica for Fig. 2.
8. References
Bellafiore, D., Guarnieri, A., Grilli, F., Penna, P., Bortoluzzi, G., Giglio, F., & Pinardi, N. (2011). Study of the hydrodynamical processes in the Boka Kotorska Bay with a finite element model. Dynam Atmos Oceans, 52(1–2), 298–321.
Bellafiore, D., Ghezzo, M., Tagliapietra, D., & Umgiesser, G. (2014). Climate change and artificial barrier effects on the Venice Lagoon: Inundation dynamics of salt marshes and implications for halophytes distribution. Ocean & Coastal Management, 100, 101–115.
Canestrelli, P. (1999). Il sistema statistico del Comune di Venezia per la previsione del livello della marea in città. Risultati teorici e in fase operativa. Venezia: Centro Previsioni e Segnalazioni maree17 (in Italian).
Cavaleri, L., Bajo, M., Barbariol, F., Bastianini, M., Benetazzo, A., Bertotti, L., Chiggiato, J., Davolio, S., Ferrarin, C., Magnusson, L., Papa, A., Pezzutto, P., Pomaro, A., & Umgiesser, G. (2019). The October 29, 2018 storm in Northern Italy — An excep-tional event and its modeling. Progress in Oceanography, 178, 102178.
Carbognin, L., Teatini, P., Tomasin, A., & Tosi, L. (2010). Global change and relative sea level rise at Venice: What impact in term of flooding. Climate Dynamics, 35(6), 1039–1047.
Collegio Di Esperti Di Livello Internazionale (1998). Report on the mobile gates project for the tidal flow regulation at the Venice lagoon inletsJune48.
Comune di Venezia (2005). Proposte progettuali alternative per la regolazione dei flussi di marea alle bocche della laguna di Venezia. 383. (in Italian) http://www2.comune. venezia.it/mose-doc-prg.
Comune di Venezia (2018). Previsioni delle altezze di marea per il bacino San Marco. Annual publication 72 p. (in Italian).
Del Bello, L. (2018). Venice anti-flood gates could wreck lagoon ecosystem. Nature, 564,
16. https://doi.org/10.1038/d41586-018-07372-3.
De Pascalis, F., Pérez-Ruzafa, A., Gilabert, J., Marcos, C., & Umgiesser, G. (2012). Climate change response of the Mar Menor coastal lagoon (Spain) using a hydrodynamic fi-nite element model. Estuarine, Coastal and Shelf Science, 114, 118–129.
Ferrarin, C., & Umgiesser, G. (2005). Hydrodynamic modeling of a coastal lagoon: The Cabras lagoon in Sardinia, Italy. Ecological Modelling, 188, 340–357.
Ferrarin, C., Umgiesser, G., Bajo, M., Bellafiore, D., De Pascalis, F., Ghezzo, M., & Scroccaro, I. (2010). Hydraulic zonation of the lagoons of Marano and Grado, Italy. A modelling approach. Estuarine, Coastal and Shelf Science, 87(4), 561–572.
Ferrarin, C., Ghezzo, M., Umgiesser, G., Tagliapietra, D., Camatti, E., Zaggia, L., & Sarretta, A. (2013). Assessing hydrological effects of human interventions on coastal systems; Numerical application to the Venice Lagoon. Hydrology and Earth System Sciences Discussions, 17, 1733–1748.
Gambolati, G., & Teatini, P. (2013). Venice shall rise again: Engineered uplift of Venice through seawater injection. Elsevier1–83.
Ghezzo, M., Guerzoni, S., Cucco, A., & Umgiesser, G. (2010). Changes in Venice Lagoon dynamics due to construction of mobile barriers. Coastal Engineering, 57(7), 694–708.
IPCC (2001). TAR climate change 2001: Synthesis report409. IPCC (2007). AR4 climate change 2007: Synthesis report112. IPCC (2014). AR5 climate change 2014: Synthesis report167.
Magistrato Alle Acque (1997). Interventi alle bocche lagunari per la regolazione dei flussi di marea–Studio di impatto ambientale del progetto di massima, Allegato 6, Tema 5. 163 (in Italian).
Melaku Canu, D., Umgiesser, G., & Solidoro, C. (2001). Short-term simulations under winter conditions in the lagoon of Venice: A contribution to the environmental im-pact assessment of temporary closure of the inlets. Ecological Modelling, 138(1-3), 215–230.
Reimann, L., Vafeidis, A. T., Brown, S., Hinkel, J., & Tol, R. S. J. (2018). Mediterranean UNESCO World Heritage at risk from coastal flooding and erosion due to sea-level rise. Nature Communications, 9, 4161. https://doi.org/10.1038/s41467-018-06645-9.
Rinaldo, A., Nicotina, L., Alessi Celegon, E., Beraldin, F., Botter, G., Carniello, L., Cecconi, G., Defina, A., Settin, T., Uccelli, A., & others (2008). Sea level rise, hydrologic runoff, and the flooding of Venice. Water Resources Research, 44(12), W12434.
Trincardi, F., Barbanti, A., Bastianini, M., Benetazzo, A., Cavaleri, L., Chiggiato, J., ... Umgiesser, G. (2016). What time taught us for the future: The 1966 Flooding of Venice. Oceanography, 29(4), 178–186. https://doi.org/10.5670/oceanog.2016.87.
Umgiesser, G., Melaku Canu, D., Cucco, A., & Solidoro, C. (2004). A finite element model for the Venice Lagoon. Development, set up, calibration and validation. Journal of Marine Systems, 51, 123–145.
Umgiesser, G., & Matticchio, B. (2006). Simulating the mobile barrier (MOSE) operation in the Venice Lagoon, Italy: Global sea level rise and its implication for navigation. Ocean Dynamics, 56, 320–332.
Umgiesser, G., Ferrarin, C., Cucco, A., De Pascalis, F., Bellafiore, D., Ghezzo, M., & Bajo,
M. (2014). Comparative hydrodynamics of 10 Mediterranean lagoons by means of numerical modeling. Journal of Geophysical Research: Oceans, 119(4), 2212–2226. https://doi.org/10.1002/2013JC009512.
Vergano, L., Umgiesser, G., & Nunes, P. A. L. D. (2010). An economic assessment of the impacts of the MOSE barriers on Venice port activities. Transportation Research Part D: Transport and Environment, 15D(6), 343–349.
Vermeer, M., & Rahmstorf, S. (2009). Global sea level linked to global temperature.
Proceedings of the National Academy of Sciences (PNAS), 106(51), 21527–21532. Water Technology (2019). Water technology (downloaded 2019) MOSE project. Venice,
Venetian Lagoon: MOSE Project. https://www.water-technology.net/projects/mose-project/.
Zampato, L., Bajo, M., Canestrelli, P., & Umgiesser, G. (2016). Storm surge modelling in Venice: Two years of operational results. Journal of Operational Oceanography, 9(Suppl. 1), s46–s57.