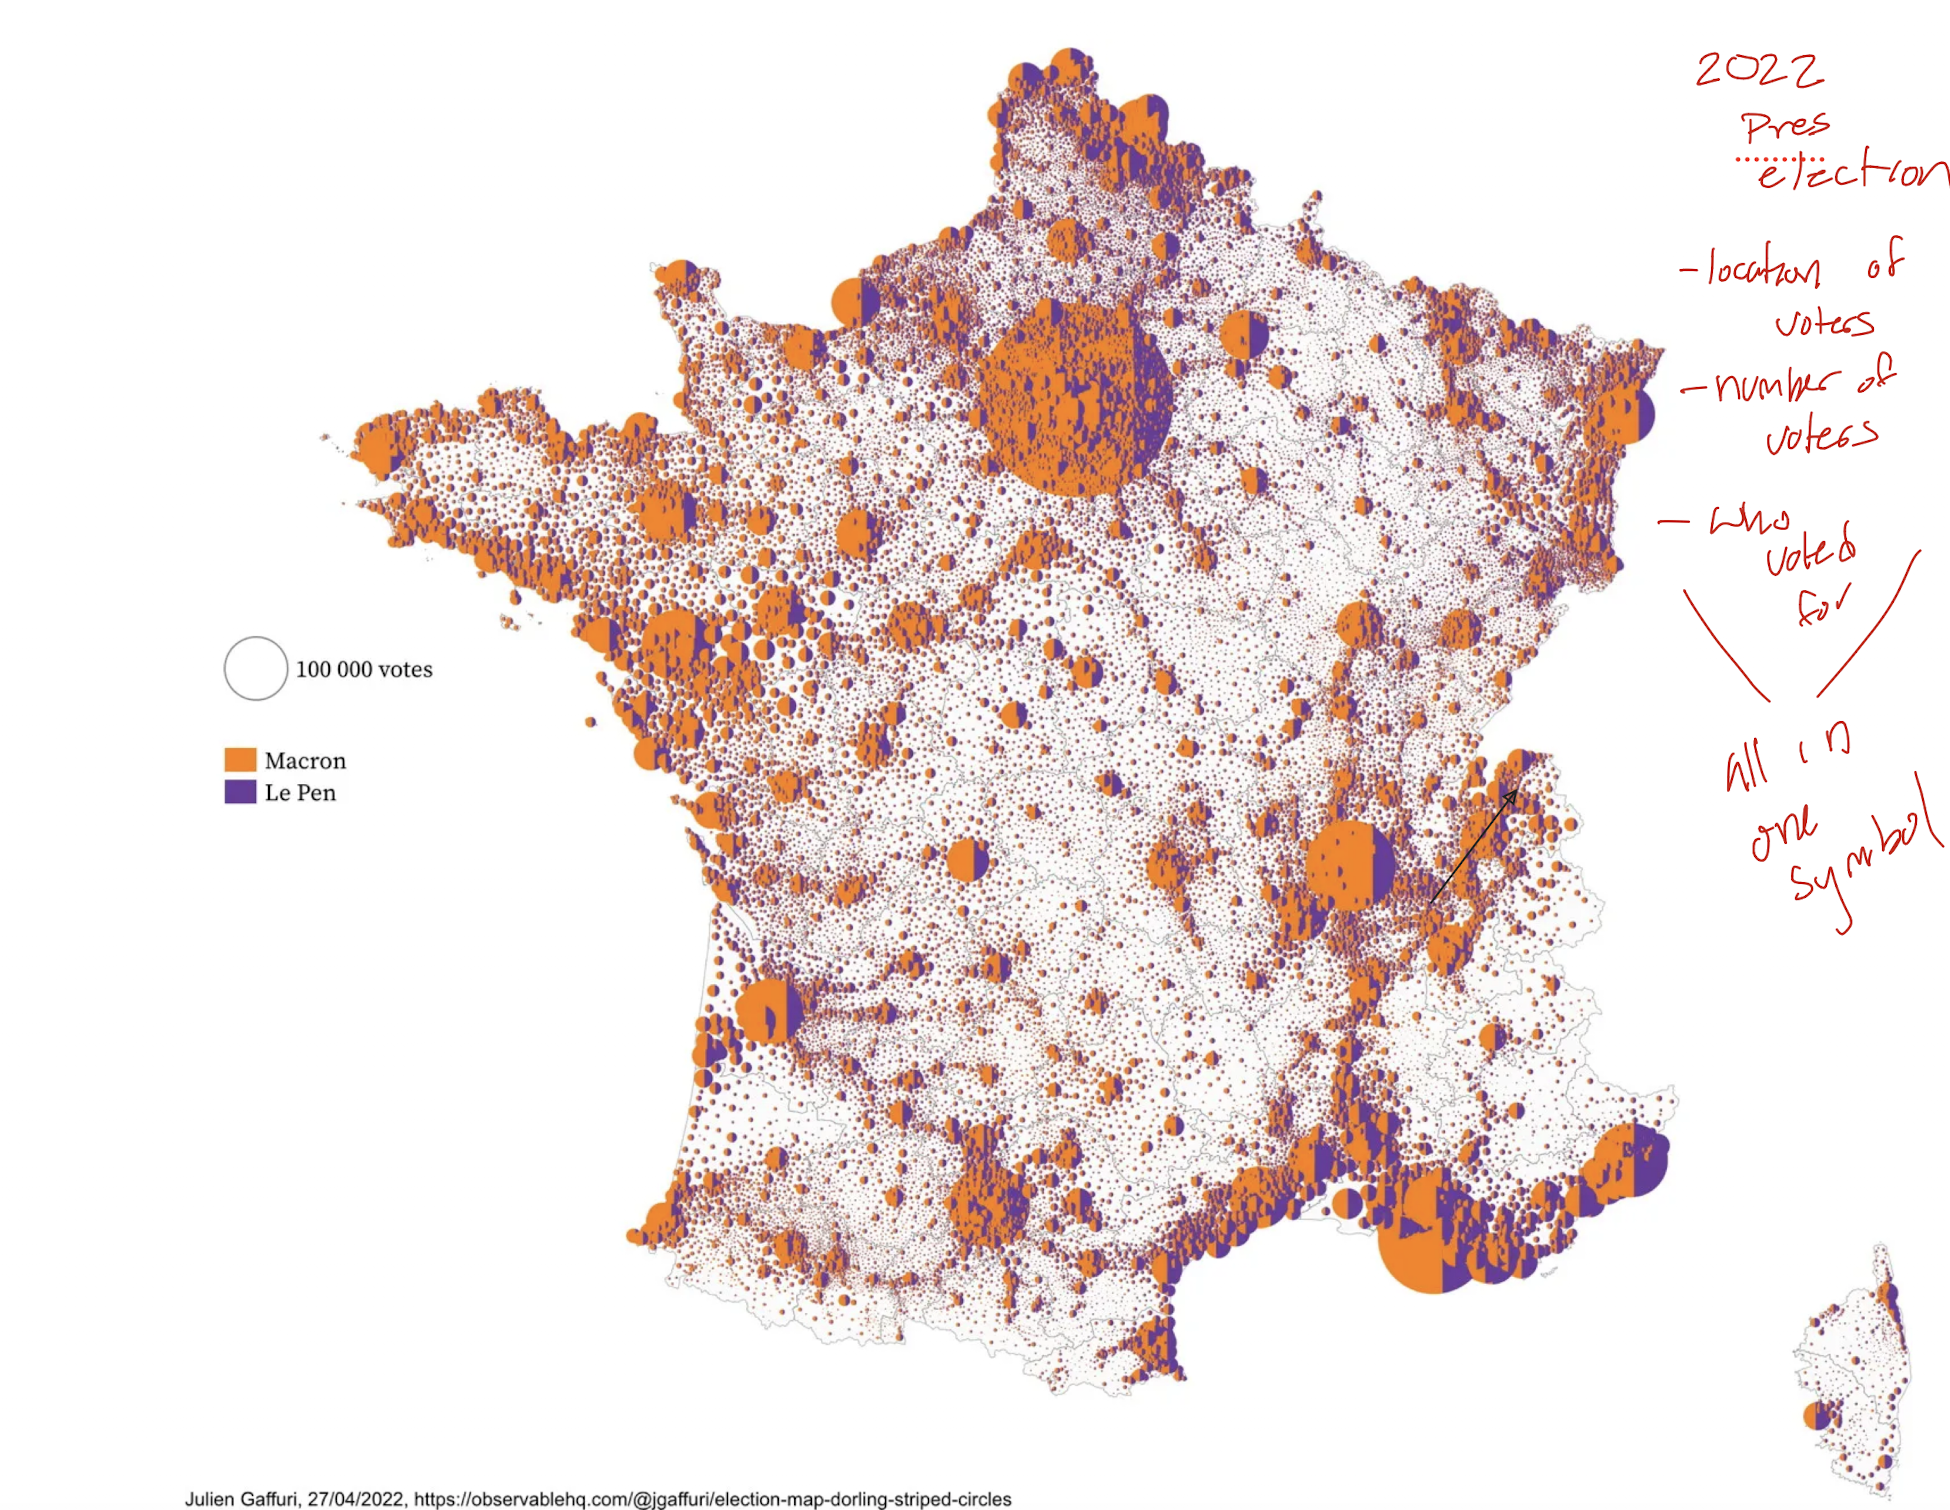
This is a map visualization from the France 2022 election. I like it because it is not only interesting to look at, but it also displays 3 types of data, all with one symbol. It is from a lecture in my GIS class (don't mind my notes on the side of the screenshot). It shows the location of voters, who they voted for, and the number of voters from the 2022 election.