
10 - Georg Umgiesser, "The impact of operating the mobile barriers in Venice (MOSE) under climate change" (2020)
10 - Georg Umgiesser, "The impact of operating the mobile barriers in Venice (MOSE) under climate change" (2020)
2. Materials and methods
The study site
The lagoon of Venice is situated in the northern part of the Adriatic Sea, a part of the Mediterranean Sea. It is about 50 km long and be-tween 10 and 15 km wide. It is connected with the Adriatic Sea by 3 inlets that have depth values ranging between 7 and 14 m (see Fig. 1). The lagoon itself has an average depth of about 1.5 m, with shallow flats at a depth of around 80 cm, salt marshes that are above sea level, but also with narrow tidal channels that may reach up to 12 m and that cut through the shallow areas.
The semi-diurnal tides create strong fluxes through the inlets that may reach during spring tides 20,000 m3/s at peak flow through all inlets. Compared to the average flow of the Po River of 1,500 m3/s this is quite an impressive value.
The pavement level of Venice is on average only about 80 cm above mean sea level. Some of its most prominent parts (Rialto, St. Mark’s square) are even lower, around 55 cm above mean sea level. Since the spring tide amplitude is 50 cm, just a small meteorological contribution will be able to flood St. Mark’s square. The local datum, which has been established in 1872, is not corresponding anymore to the mean sea level but is 30 cm lower (Comune di Venezia, 2018) due to subsidence and sea level rise in the 20th century. In this work all water levels are re-ferred to this local datum. Therefore, the actual mean sea level is at 30 cm above datum and a closing level of 110 cm (above datum) as described below is at a level of 80 cm above mean sea level. In order to better explain this situation Fig. 2 can be consulted where possible le-vels of sea level rise and the flooding of the city due to the astronomical tide are shown.
The numerical model description
A framework of numerical models (SHYFEM, http://www.ismar. cnr.it/shyfem) was applied to the domain that represents the Venice lagoon (Fig. 1). These models consist of a finite element 3-D hydro-dynamic model, a transport and diffusion model and a radiation transfer model of heat at the water surface. SHYFEM was previously successfully applied to many coastal environments (Bellafiore et al., 2011; De Pascalis, Pérez-Ruzafa, Gilabert, Marcos, & Umgiesser, 2012; Ferrarin & Umgiesser, 2005; Ferrarin et al., 2010; Ferrarin et al., 2013; Umgiesser et al., 2014).
The model resolves the 3-D primitive equations, vertically in-tegrated over each layer, in their formulations with water levels and
transports. The horizontal spatial discretization of the unknowns is carried out with the finite element method, which is especially well suited to describe the complex morphology of the investigated coastal system. In this application, the model is applied in its 2D version, which perfectly adequate due to the shallow nature of the lagoon and the scope of this study which is tidal propagation inside the lagoon. The SHYFEM model has been validated in previous works reproducing water level and current velocities in the Venice lagoon. For more details of the model equations and their solution please see Umgiesser, Melaku Canu, Cucco, and Solidoro (2004).
In order to simulate the closing of the inlets a special module has been implemented that allows the fluxes at the inlets to be reduced and to simulate the closing of the mobile gates. The exact closing protocol is described in the next section.
The closing procedure
The closing procedure is described in some internal reposts of the Consorzio Venezia Nuova, the engineering company that oversees and coordinates the building of the MOSE. A detailed description can be found in another article (Umgiesser & Matticchio, 2006). However, here we present the most important parts of this procedure.
The closing procedure is based on two water level values, one predicted and one measured at Punta Salute, the historical tide gauge that is in place now for more than 150 years. The decision to close the barriers is based on the forecasted water level at Punta Salute. If 4 h before the peak level this maximum value is higher than the safe-guarding value, then the decision to close the lagoon is taken. The safeguarding value is normally set at a value of 110 cm, because this is the topographic level to which most of the pavements of the historic city have been raised. Please note that this safeguarding level will avoid the flooding of a large parts of Venice, but it will not avoid the flooding of St. Mark’s square.
Once the decision has been taken to close the lagoon, a threshold value is established that will be used to decide when the barriers are closed. Depending on the meteorological situation (wind speed, rain) this threshold value is between 55 cm (extreme events) and 90 cm (normal storm surge). When the measured water level at Punta Salute has reached this threshold value, the barriers start to close. The closing of the barriers will take 30 min, and in all three inlets the barriers will be closed at the same moment.
The opening procedure is not described in the report mentioned; therefore, we have applied an empiric modus operandi. When the water level is falling outside in the Adriatic Sea and its value is lower than inside the inlet, the inlet is again opened. In addition, the opening procedure is estimated to take 30 min. In this case, however, it is clear that depending on the water level close to the barriers, the three inlets may be opened at different times. Inlets that experience a set up inside the lagoon will open earlier than inlets where the water level is lower. Summarizing, the predicted water level at Punta Salute is used for the decision, if the gates have to be closed, but the observations at Punta Salute are used to decide, when to close. Finally, the local water level difference between inside and outside the lagoon will be used for
the decision when to re-open the lagoon.
Water level variation in the closed lagoon
When the lagoon is closed, the water level might still change. This is true because of rainfall, river discharge and leakage through the barrier elements. While the first two points are easily integrated into the si-mulations by adding the rain as a distributed source and the rivers as point sources, the third point needs some explication. Every inlet con-tains a certain number of single barrier elements, the Lido (northern-most) has two barriers with 21 and 20 elements, Malamocco (central) has 19 and Chioggia (southern) 18. The elements are 20 m wide and are not connected between each other. This means that there is some gap
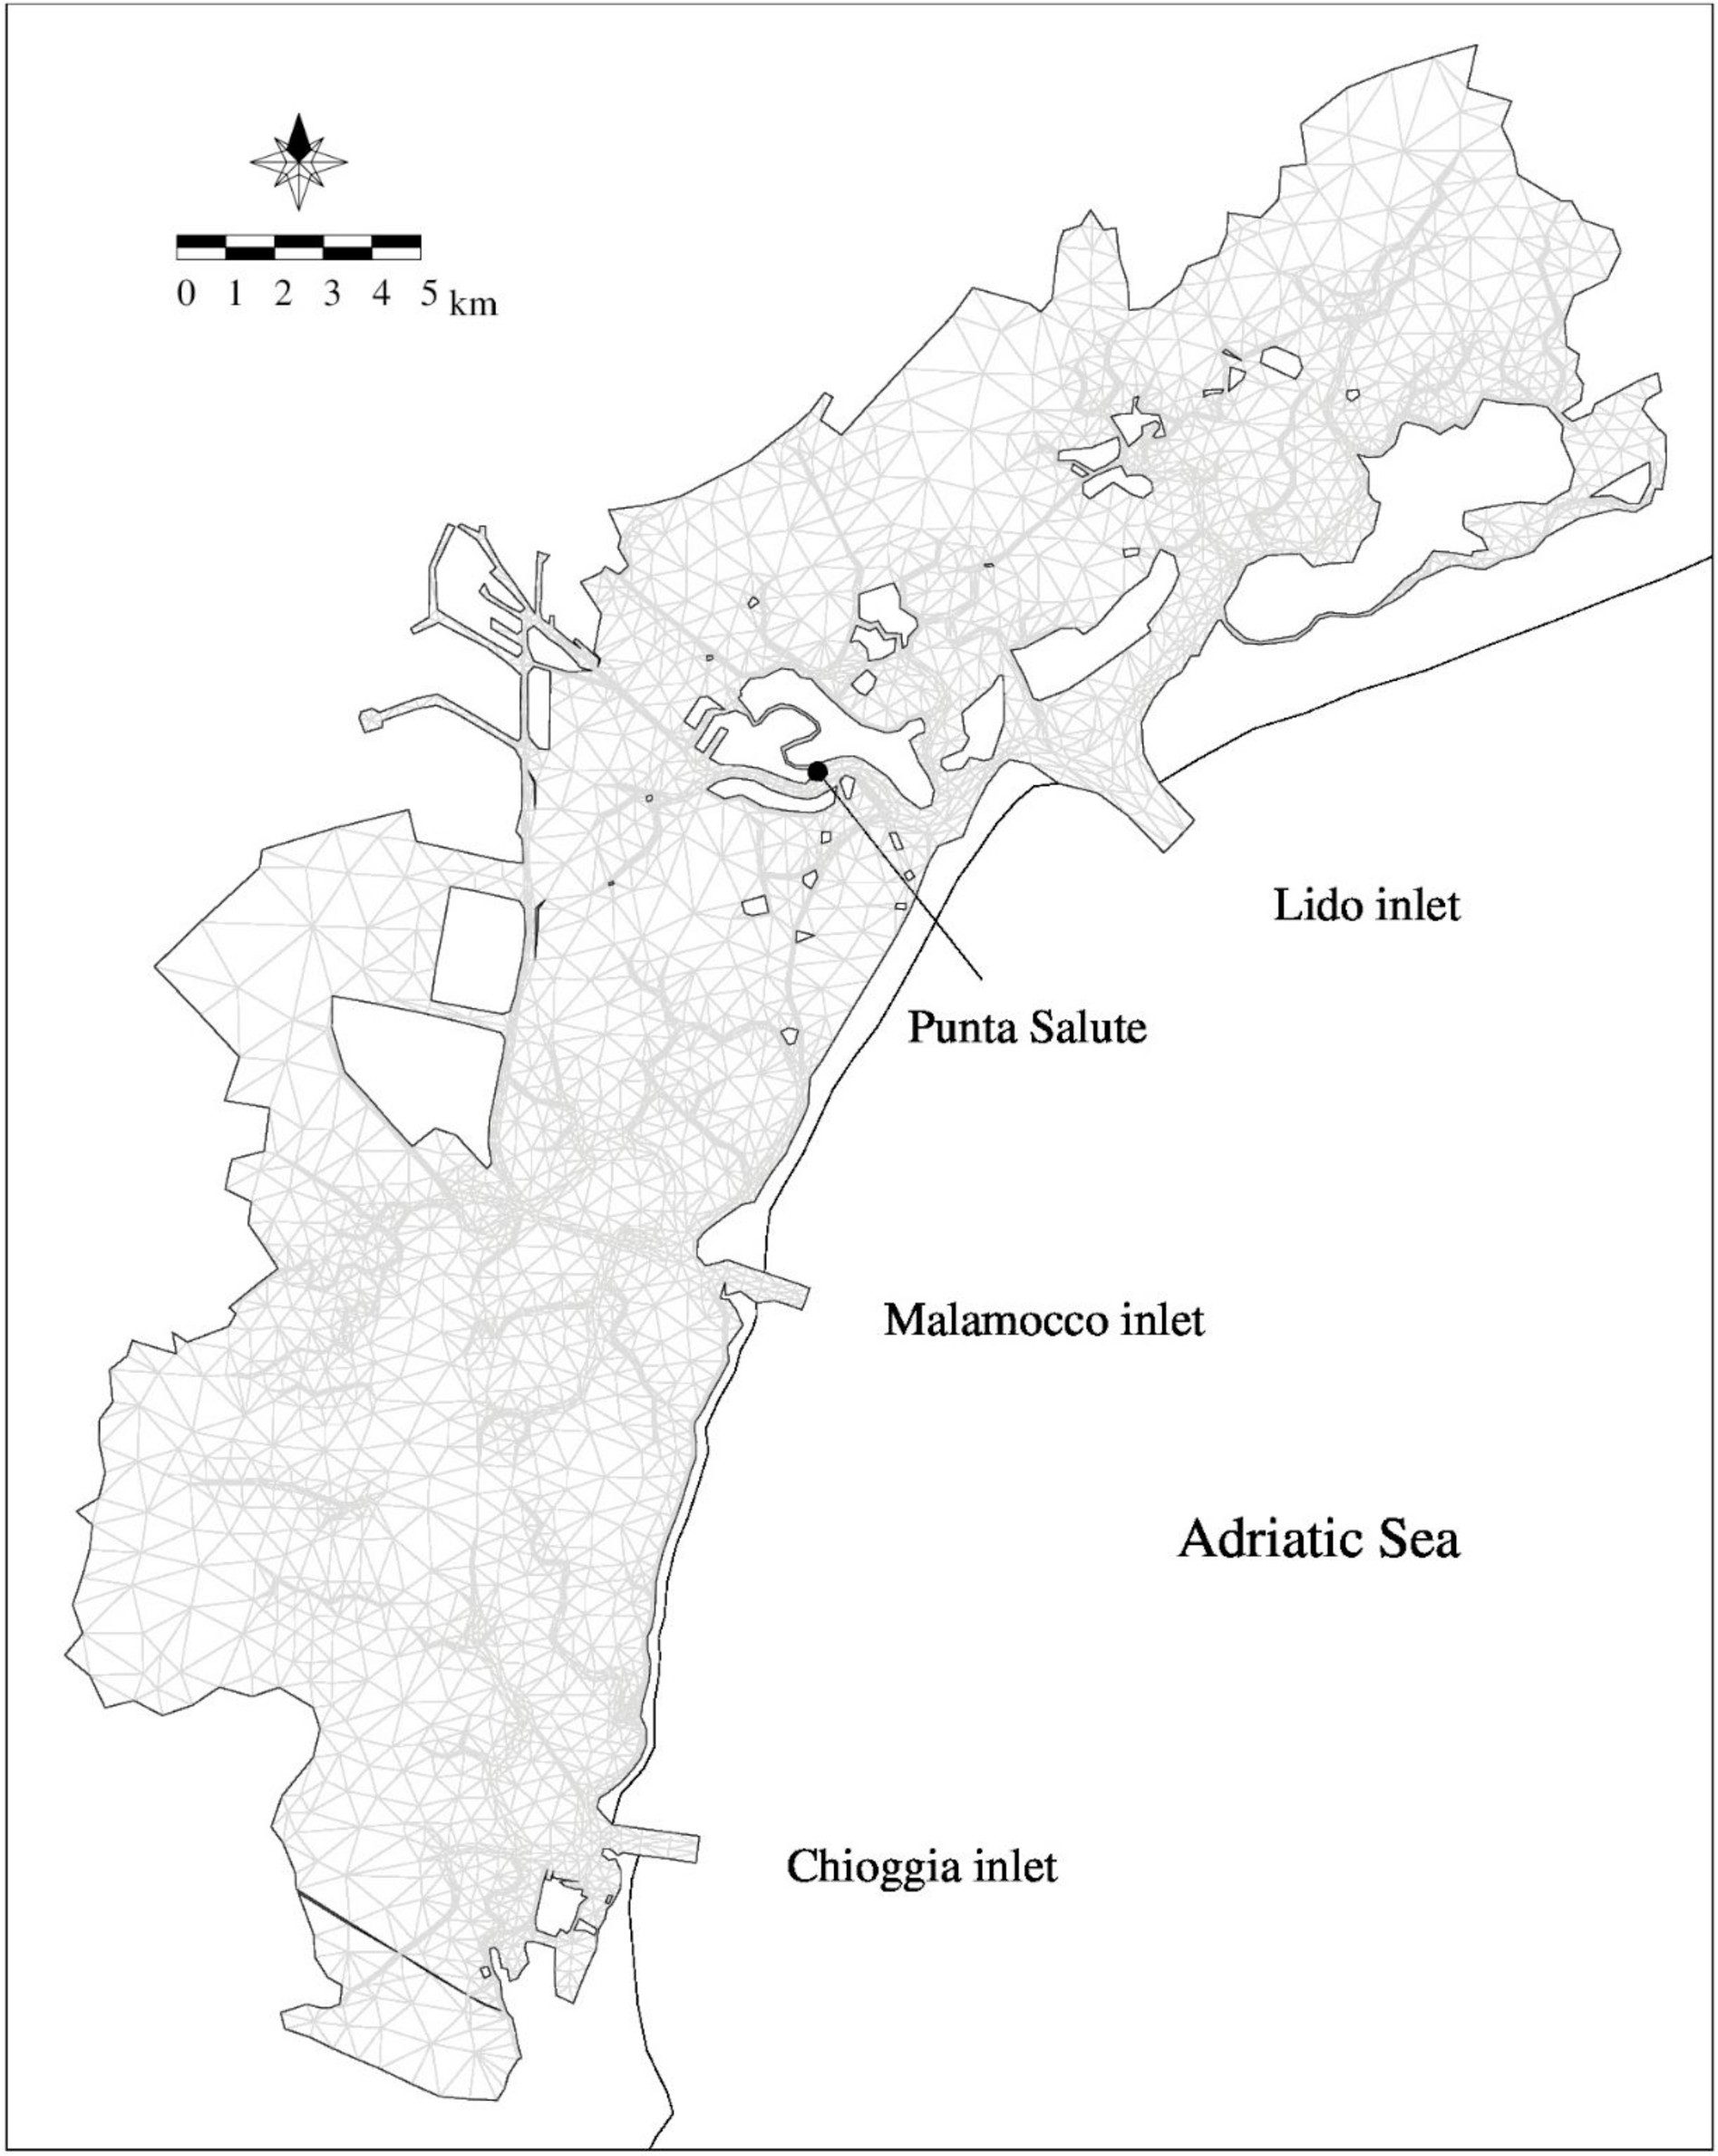
Fig. 1. Overview map of the Venice Lagoon. Indicated are the three inlets and the tide gauge Punta Salute in the city center. Superimposed is the finite element grid used for the simulations.
(about 5−10 cm) between the elements and that the elements can also oscillate. The stronger the waves (and the wind), the more the elements start to oscillate, with the effect that more water can enter between the elements.
A study (Collegio Di Esperti Di Livello Internazionale, 1998) has estimated the water level rise inside the lagoon due to the water leakage between the barrier elements, and values range from 2.7 mm/h for calm
conditions to 21 mm/h for high waves under stormy weather. A non-linear correlation between wind speed and water level rise has been derived (which can be found in Umgiesser & Matticchio, 2006) and implemented in the model code. The highest water level rise of 21 mm/ h is assumed for wind speeds of over 25 m/s.
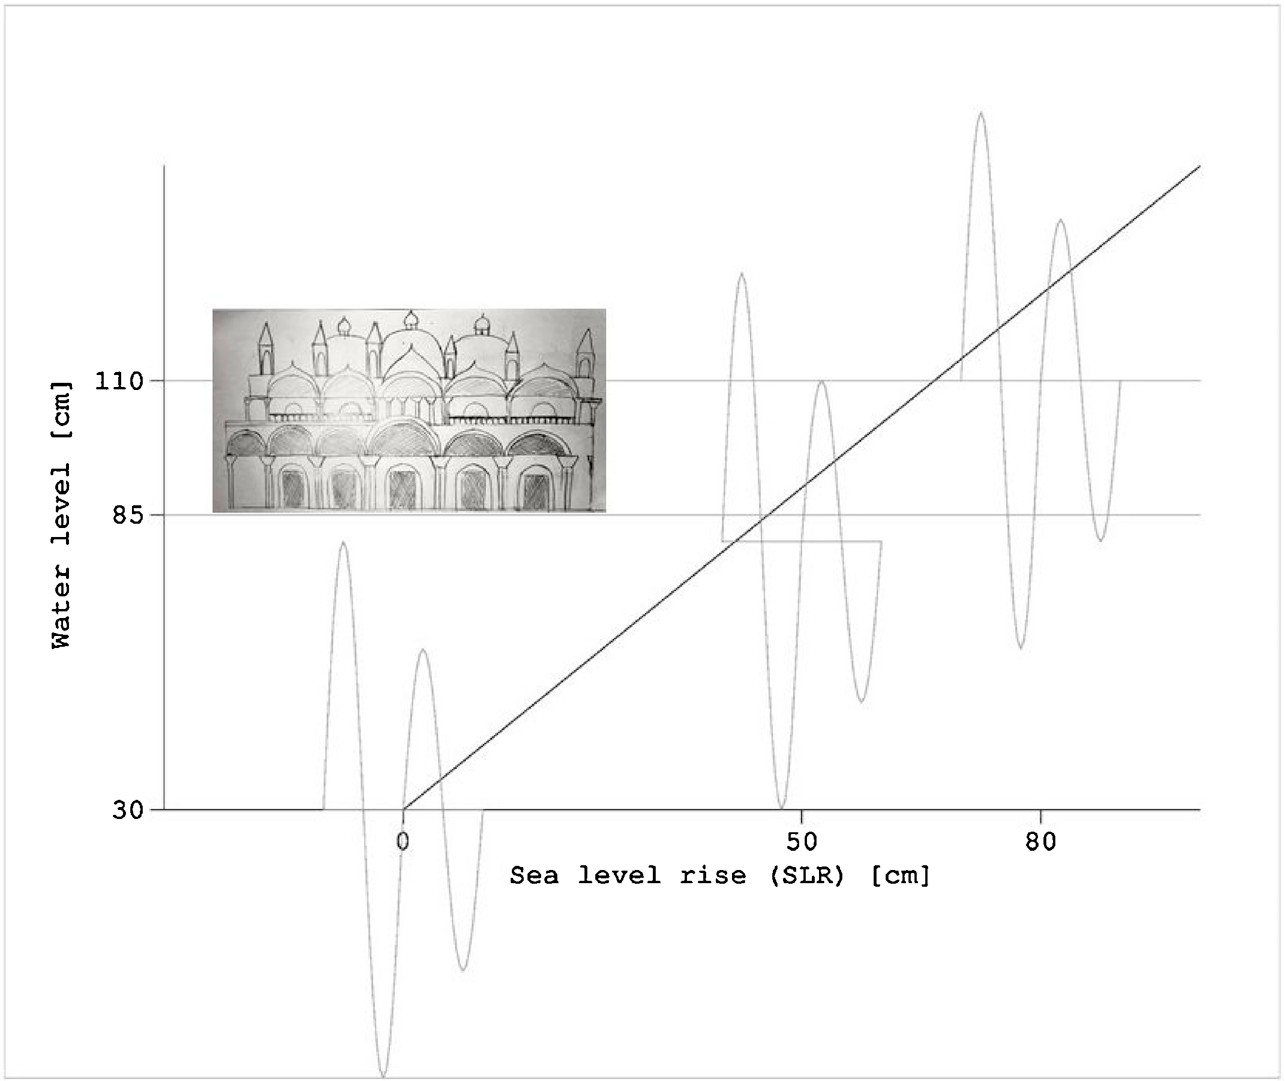 Fig. 2. Sea level rise and the associated average water level in Venice. On the x-axis the possible SLR are plotted, and on the y-axis the important topographic levels referred to datum for Venice are indicated. A level of 30 cm above datum correspond to the present average water level, 85 cm to the medium height of St. Mark’s square (indicated by the sketch, the sketch is not to scale), and 110 cm to the safeguarding level, which is also the height to where most of the pavement of the city of Venice has been raised. In the figure also the oscillation of an astro-nomical spring and a neap tide has been inserted. As can be seen, with a SLR of 50 cm St. Mark’s square is flooded nearly half of the time.
Available data
In this study, measured wind and rain data is used for the years 2000–2002. The data is observed at the oceanographic tower of CNR, about 8 nautical miles in front of the Venice Lagoon, in the Adriatic Sea. In operational use, this has to be clearly substituted with data coming from operational forecast models. Using observed data removes the uncertainty connected with the meteorological situation. For the above period real forecast data for water levels (Canestrelli, 1999) has been made available by the Tidal Forecast Center of Venice Municipality (CPSM). This does effectively allow accounting for the uncertainty with water level predictions, which is an important factor in operating the MOSE barriers and may lead to both false alarms, useless closures and missed closures. This will then also influence the statistics of closures of the barriers.
The reason to use the years 2000–2002 is because only for these years water level forecast data coming from the operational model was available. For these years the average number of events above 110 cm is 8 per year, which is in line with the last 20 years, where we have ap-proximately 6 events per year.
Hourly river data was not available, only climatological averages could be retrieved that cannot be used for this study. The matter has been resolved by using the same amount of rain for the rivers. As pointed out by another study (Rinaldo et al., 2008), this eventually overestimates the river input, which would be more diluted in time. However, it is anticipated that the important findings in this study are not depending on this detail, and the statistics provided later in the paper are only marginally impacted by this decision.
The simulations
The model has been run for 3 years (2000–2002) in a variety of configurations. First of all, sea level rise (SLR) has been simulated by increasing the average sea level in 10 cm steps, from the present state (0 cm) up to a catastrophic sea level rise of 200 cm. This is not to imply that such a value for the SLR is probable at the end of this century, but to show the long term effects that the SLR has on the possible closures of the mobile barriers.
A first set of simulations is carried out by simply running the model
for the three years without any mechanism of closing. This is called, for every SLR, the reference simulation (REF). A second set of simulations (FOR) is then run by simulating the mobile barrier operations. Every time the procedure described above, using the water level forecast, makes the decision to close the gates, the lagoon is closed by artificially reducing the discharge through the inlets to zero, effectively detaching the lagoon from the sea. This is done for all three inlets.
In another set of simulations (SEC), and in order to effectively ac-count for the uncertainty of the water level prediction (important for the decision to close the barriers), a so-called security increment has also been introduced. This security increment is added to the water level forecast to make sure that, even in case of an erroneous forecast, the mobile gates would still be closed and Venice would not be subject to flooding. Uncertainty of the forecast in case of stormy conditions is presently in the order of 10 cm (Zampato, Bajo, Canestrelli, & Umgiesser, 2016). Therefore, 10 cm have been used for this security increment.
Another set of simulations is also carried out where the forecast data has been substituted by observed data of the water level (OBS). In this way, the uncertainty of the water level forecast has been completely eliminated. This is certainly the best scenario for what concerns flooding of Venice and the estimated number of closures (no false alarms and no missed closures). All sets of simulations are summarized in Table 1.
All simulations have been carried out accounting for the leakage of water through the barriers as well as river and rain input. As described above, river data has been estimated through rain data. In any case, extra simulations that have been carried out (and are not shown here) indicate that this assumption is not crucial for the results shown later.