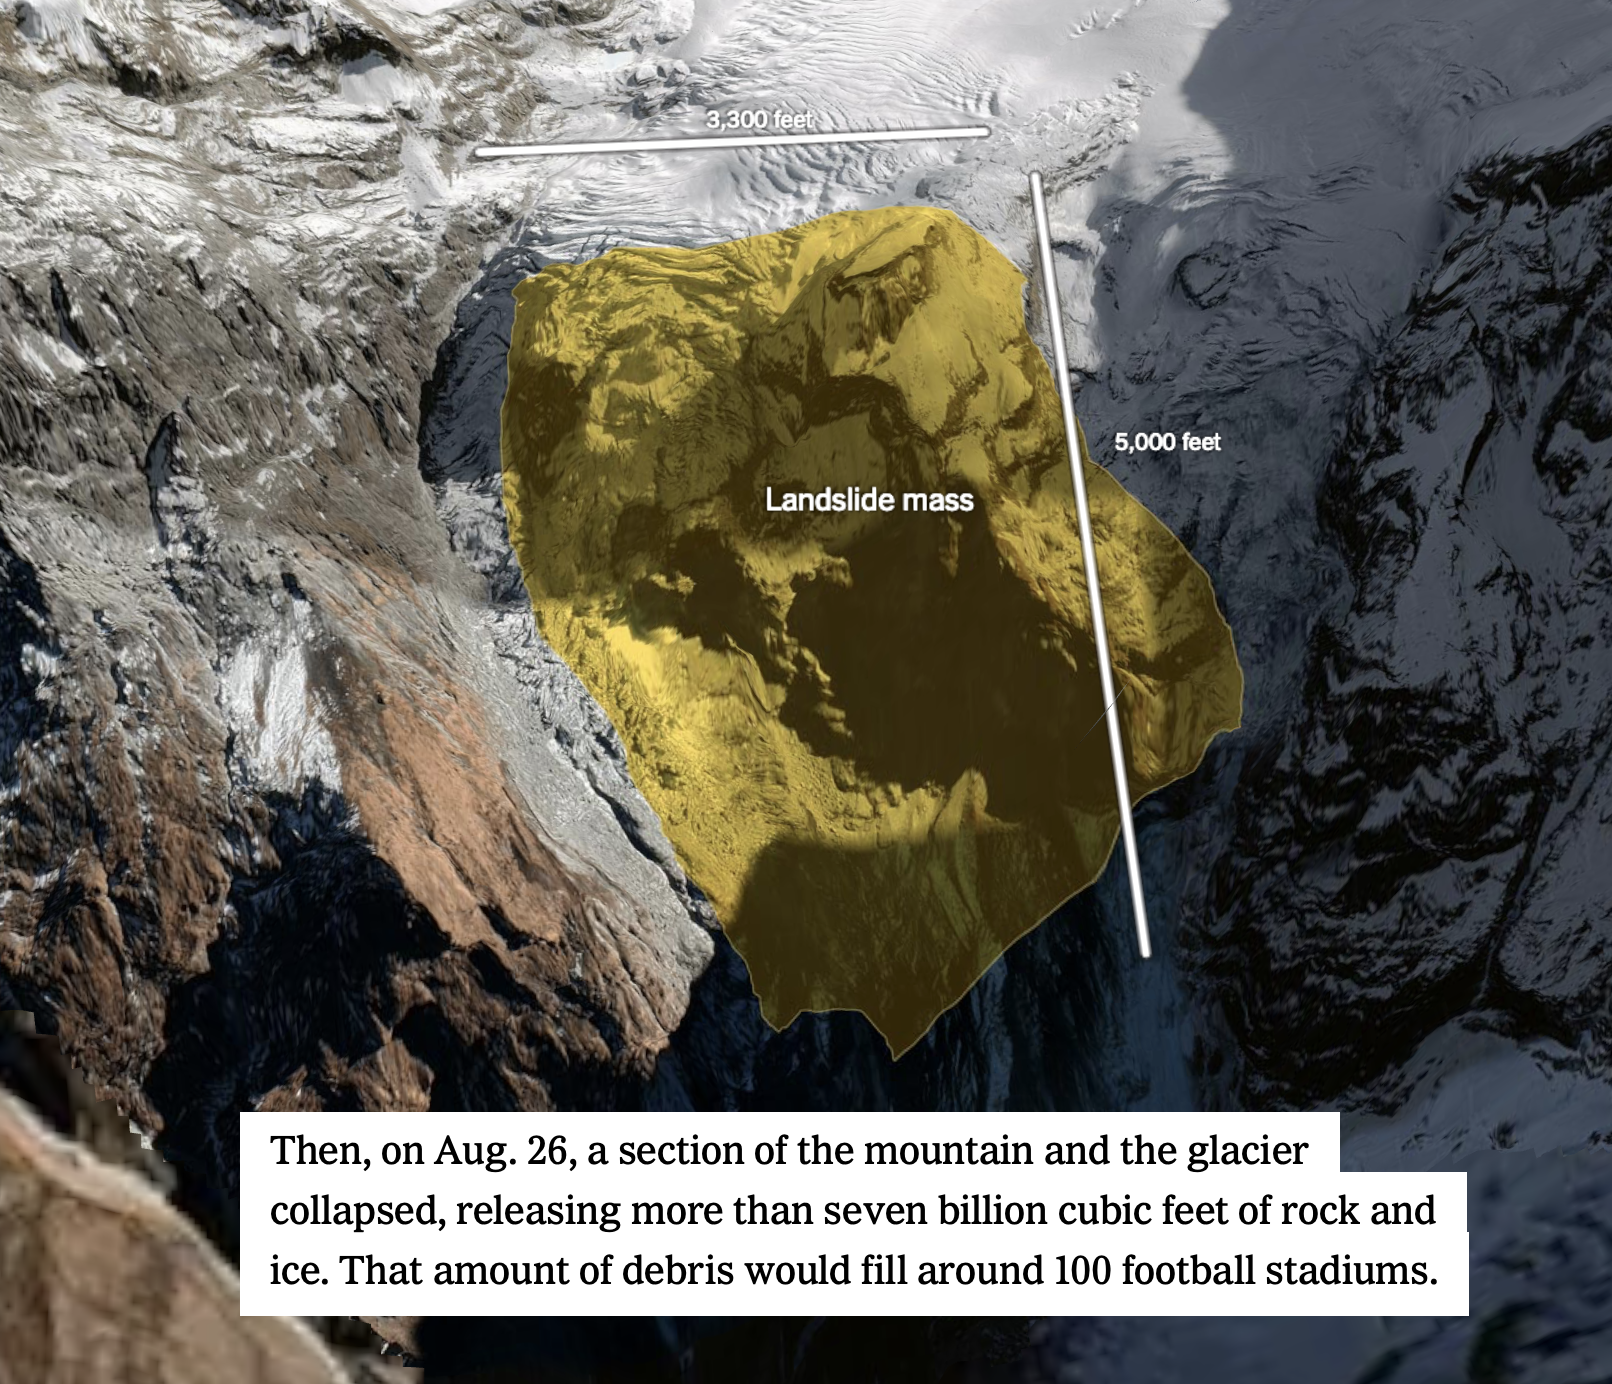
The specific model uses data visualization models such as satellite imagery data visualization and 3D terrain sensing. The journalists utilized imagery from before and after the landslide occurred through Landsat 9 imagery (a form of geospatial data/NASA imagery that is a combination of digital pictures and scientific data from earth's land surfaces) from Aug 10 - Aug 26th. The visualization is a powerful and educative model to help breakdown and illustrate the reasoning for the abrupt flood for the daily reader to better comprehend, in addition to clips of the actual flood from news outlets.
Post a Data Visualization by 9/10 class
Flash Flood in Nepal
The due date for posting to this forum was Thursday, May 7, 2026, 2:15 PM.